


Heiken Ashi Trend Fortsættelse Forex Strategi
Heiken Ashi er en type lysestage baseret diagram. Ligesom de almindelige lysestager viser den også lys med væge og krop. Men deres ligheder stopper der.
I modsætning til det almindelige lysestagediagram viser Heiken Ashi-diagrammet ikke retningen af lyset, såvel som den åbne, høje, lave og lukkede pris. Dette skyldes, at Heiken Ashi-diagrammet er baseret på en matematisk formel, der er beregnet til at lægge vægt på retningen af trenden, snarere end selve stearinlyset. Farven på lysene er baseret på trendens retning. Nogle Heiken Ashi-diagrammer kunne vise stearinlysets høje og laveste, mens andre variationer ikke gør.
Nedenfor er et eksempel på et almindeligt Heiken Ashi-diagram.
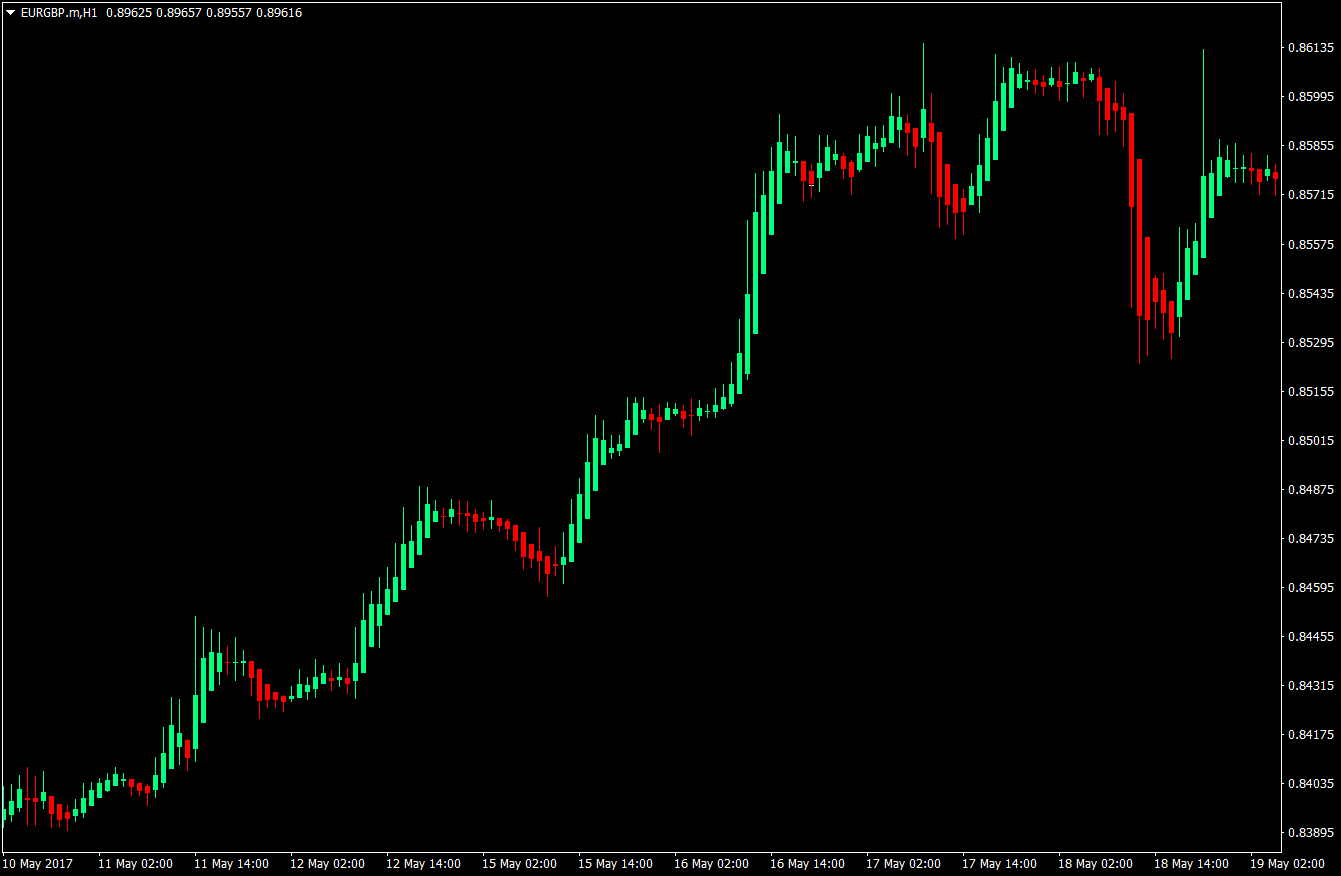
Som du vil bemærke, sammenlignet med et almindeligt lysestagediagram, er trends på Heiken Ashi-diagrammet nemmere at identificere på grund af farven på lysene.
Heiken Ashi Smoothed Chart
En anden variation af Heiken Ashi-diagrammet er Heiken Ashi Smoothed-diagrammet. Dens matematiske formel adskiller sig fra det almindelige Heiken Ashi-diagram, hvilket gør tendenserne jævnere. Dens tilbageslag er dog, at den ikke viser de faktiske højder og nedture af lysestagerne.
Her er et eksempel på Heiken Ashi Smoothed-diagrammet.
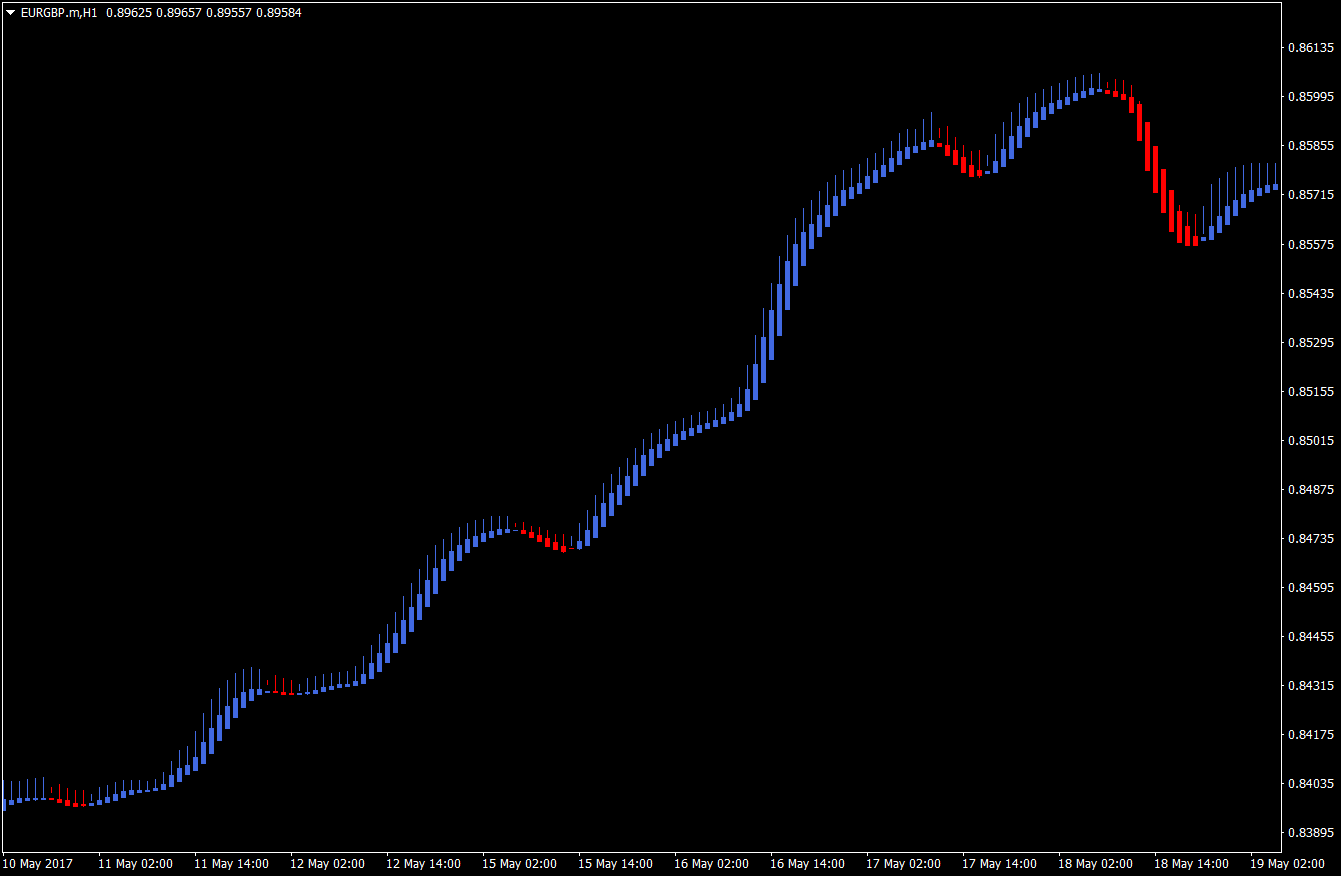
Som du vil bemærke, er tendenser endnu mere klart definerede. Det er dog umuligt at identificere prishandling, fordi der ikke er nogen op- og nedture vist på diagrammet. Dens styrke er dog i at vise retningen af trenden. Vendninger har en tendens til at være mere pålidelige med Heiken Ashi Smoothed-diagrammet sammenlignet med det almindelige Heiken Ashi-diagram.
Med denne strategi vil vi maksimere styrken af Heiken Ashi Smoothed-diagrammet, som definerer retningen for den kortsigtede trend.
100 Eksponentielt glidende gennemsnit (EMA) filter
Da styrken af Heiken Ashi Smoothed-diagrammet er at definere den kortsigtede trend, har vi brug for en glidende gennemsnitsindikator for at identificere den langsigtede trend. Til dette vil vi bruge 100 Exponential Moving Average (EMA).
Diagramlayoutet
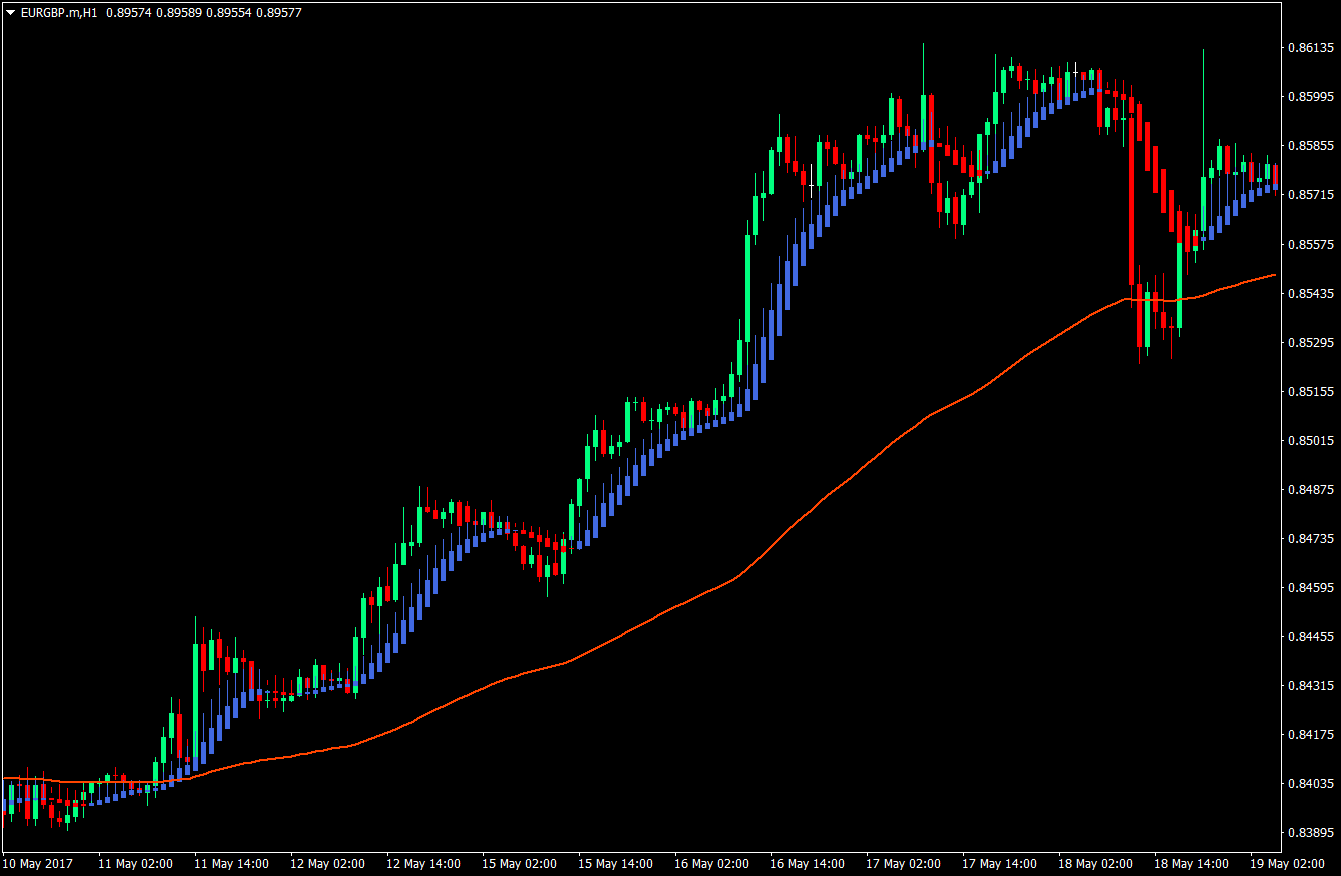
Til vores skabelon vil vi placere Heiken Ashi Smoothed-diagrammet og det almindelige lysestagediagram. På en måde fungerer Heiken Ashi Smoothed-diagrammet som en kortsigtet trendindikator.
Diagrammet skal ligne det, der er vist nedenfor.
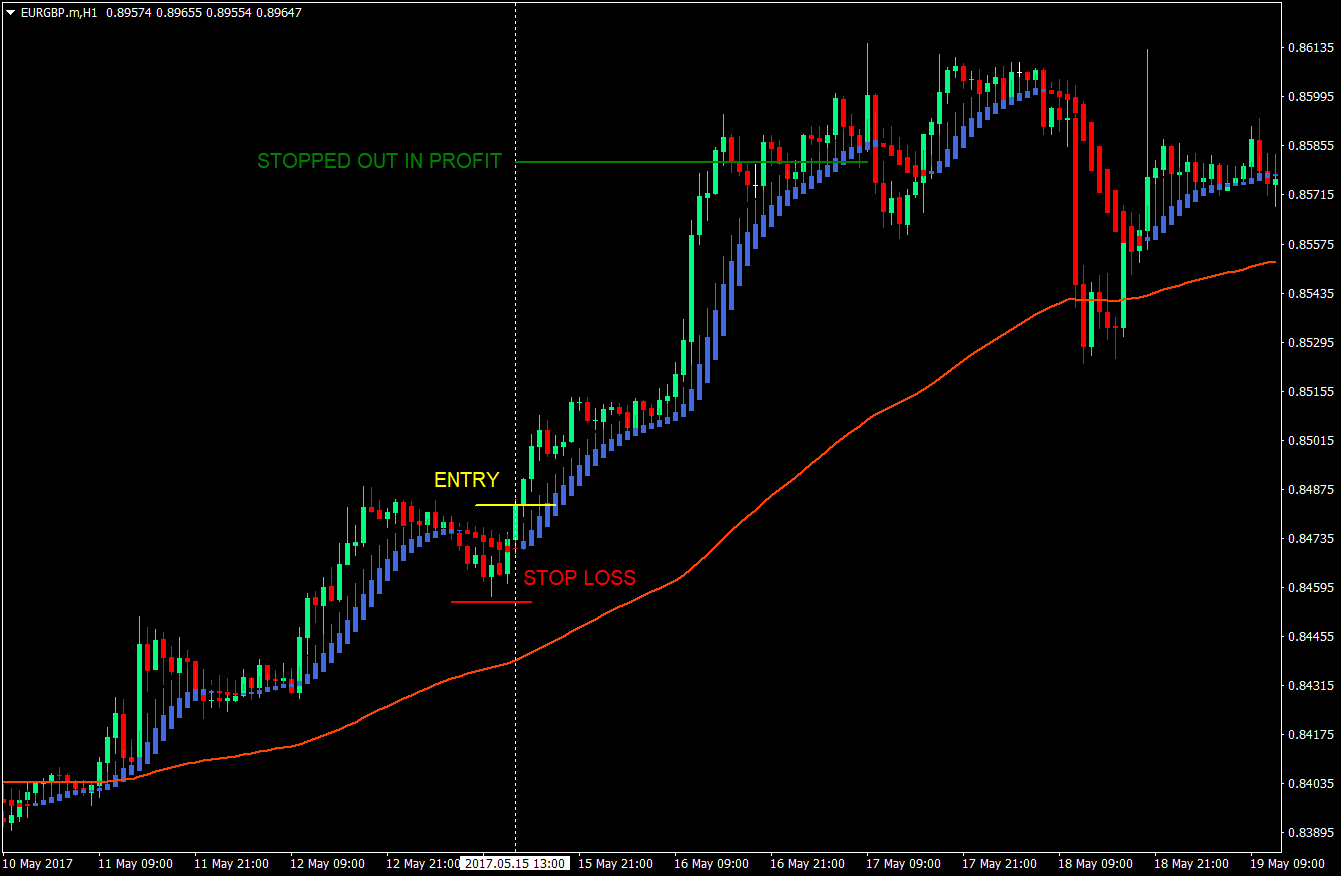
Køb-opsætningen – Entry, Stop Loss & Exit
Køb adgangsregler:
- Prisen skal være over 100 EMA
- Prisen er i opgang
- Kommer du fra et rødt Heiken Ashi Smoothed stearinlys på grund af en retracement, skal du indtaste det første blå Heiken Ashi Smoothed stearinlys, hvilket betyder, at trenden er genoptaget
Stop Loss: Stoptabet skal placeres et par pips under swing low dannet på retracementet.
Efterfølgende stoptab: Så snart prisen er på 1:1 risikobelønningsforhold, bør stoptabet følges et par punkter under Heiken Ashi Smoothed-stearinlysene, indtil handlen stoppes i profit.
Sælg-opsætningen – Entry, Stop Loss & Exit
Indgangsregler for salg:
- Prisen skal være under 100 EMA
- Prisen er på en nedadgående tendens
- Kommer fra et blåt Heiken Ashi Smoothed stearinlys på grund af en retracement, skal du indtaste det første røde Heiken Ashi Smoothed stearinlys, hvilket betyder, at trenden er genoptaget
Stop Loss: Stoptabet skal placeres et par pips over swing high dannet på retracementet.
Efterfølgende stoptab: Så snart prisen er på 1:1 risikobelønningsforhold, bør stoptabet følges et par pips over Heiken Ashi Smoothed stearinlysene, indtil handlen stoppes i profit.
Konklusion
Denne strategis styrke ligger i, at det er en trendfortsættelsesstrategi. Ikke nok med, at det er en trendfortsættelsesstrategi, er både de langsigtede og de kortsigtede tendenser i samspil. At have 100 EMA og Heiken Ashi Smoothed i sammenløb øger pålideligheden af strategien.
En anden styrke, som denne strategi har, er dens tendens til at fange hele det kortsigtede træk på grund af det efterfølgende stop. Ved at gøre dette forbedres risikobelønningsforholdet, hvilket også øger handelsfordelen.
Det skal dog bemærkes, at stoptabet ikke bør følges med det samme, før overskuddet er på 1:1. Dette skyldes, at da stop-losset bliver fulgt i nærheden af Heiken Ashi Smoothed, er der en tendens til, at stop-losset kan blive ramt for tidligt.
Samlet set er denne strategi en af dem, der har en klar handelsfordel på grund af den høje sandsynlighed for succes pr. handel og det høje risikobelønningsforhold.
Anbefalet MT4 Broker
- Gratis $ 50 For at begynde at handle med det samme! (Udtrækbar fortjeneste)
- Indbetalingsbonus op til $5,000
- Ubegrænset loyalitetsprogram
- Prisvindende Forex Broker
- Yderligere eksklusive bonusser Gennem året

Klik her nedenfor for at downloade: