


Selvom mange ikke-handlere og endda handlende mener, at handel er meget vanskelig, er sandheden i sagen, at konceptet med handel på forexmarkederne er meget enkelt. Forex-handlere skal simpelthen købe et valutapar, når de tror, at prisen stiger og sælge det tilbage til markedet, når prisen er højere end deres indgangspris. På bagsiden kan handlende også shorte et valutapar, når de tror, at prisen vil falde, og derefter købe det tilbage igen, når prisen er lavere end deres indgangspunkt.
De fleste forhandlere oplever dog mange problemer med at handle på forexmarkedet, ikke fordi det er svært, men fordi de overkomplicerer tingene. En af mine handelsvejledere sagde endda, at hovedårsagen til, at forex trading er svært, ikke er fordi det i sagens natur er svært, men fordi handlende føler behov for at gøre noget for at tjene, selvom de bare skal lade deres handler spille ud. Hvis en erhvervsdrivende har en rentabel handelsstrategi, bør han eller hun være i stand til at tegne ensartet overskud på lang sigt. Loven om store tal ville bevise for dem, at deres strategier er rentable.
Med det sagt kunne simple handelsstrategier fungere meget godt på forexmarkedet. Så længe en erhvervsdrivende enten vinder oftere, end de taber, som i en strategi med høj gevinstrate, eller vinder større, end de taber, hvilket er en højrisiko-belønningsstrategi, bør den erhvervsdrivende være rentabel i det lange løb.
Simple handelsstrategier såsom mønsterudbrud fungerer godt på forexmarkedet eller ethvert andet handelsmarked. Dette skyldes, at disse breakout-punkter ofte er indgangspunkter med høj sandsynlighed for at komme ind på markedet. Oven i dette tillader de fleste mønsterhandelsstrategier et positivt risiko-belønningsforhold.
Heiken Ashi lysestager
Handlende har traditionelt set deres diagrammer som et søjlediagram. Så kom de japanske lysestager, som revolutionerede den måde, handlende ser på deres diagrammer. Nu kan de nemt identificere retningen af hvert stearinlys baseret på dets farve. Handlende kunne også let fortolke prishandlinger baseret på den høje og lave pris i forhold til dens åbnings- og lukkekurs. De fleste handlende bruger i dag japanske lysestager til at se et omsætteligt værdipapir eller forex-par.
Der er dog også for nylig udviklet nye innovationer fra japanerne. Heiken Ashi lysestagerne er en ny metode til at se prisen på, som er en modifikation af de originale japanske lysestager.
Heiken Ashi lysestager plotter standarden høj og lav for hver periode ligesom den originale japanske lysestage. Men i stedet for at plotte åbningen og lukningen af hvert stearinlys, ændrer Heiken Ashi lysestagerne det baseret på den gennemsnitlige prisbevægelse. Dette skaber stearinlys, der kun skifter farve, når den kortsigtede trend eller momentum har ændret sig.
Heiken Ashi lysestagerne er fremragende indikatorer til at hjælpe handlende med at identificere kortsigtede momentumvendinger såvel som den aktuelle kortsigtede trendretning.
Bevægende gennemsnitlig konvergens og afvigelse
Moving Average Convergence and Divergence eller mere populært kendt som MACD, er en klassisk momentum teknisk indikator, som sandsynligvis er en af de mest udbredte oscillerende tekniske indikatorer.
MACD er, som navnet antyder, baseret på krydsningen af et par glidende gennemsnit.
Det beregnes ved at trække værdien af et eksponentielt bevægeligt gennemsnit (EMA) fra en hurtigere bevægende EMA-linje. Dette er normalt plottet som en histogrambjælke, der repræsenterer MACD.
Derefter udledes en signallinje fra de tidligere MACD-stænger eller linje. Signallinjen er grundlæggende en Simple Moving Average (SMA) af de tidligere MACD-stænger eller -linjer.
Trendretning og bias er baseret på placeringen af MACD-stængerne eller -linjen og signallinjen i forhold til dens midterlinje, som er nul. Positive værdier indikerer en bullish trendbias, mens negative værdier indikerer en bearish trendbias. Tendensen betragtes også som bullish, hvis MACD-stængerne eller -linjen er over signallinjen, og bearish, hvis den er under signallinjen.
Trading Strategi
Heiken Ashi 20-50 Forex Trading Strategy er en simpel trendfølgestrategi, som er baseret på momentumudbrud af støtte og modstande dannet under retracement- eller kontraktionsperioder. Det gør også brug af de to indikatorer ovenfor til at bekræfte handelsopsætningen.
MACD bruges til at identificere trendretningsbias. Dette er baseret på, om histogramstængerne og signallinjen er positive eller negative. Dette bør også stemme overens med trendretningen angivet ved krydsningen af 20-perioders og 50-perioders EMA-linjer.
I løbet af et trendmarked bør prisen vende tilbage mod området af 20-perioders EMA-linjen. Dette skulle skabe en mindre støtte- eller modstandslinje. Handelsopsætninger udvikles efterhånden som prisen bryder ud af støtte- eller modstandslinjen i retning af trenden.
Heiken Ashi lysestagerne bruges til at bekræfte den kortsigtede momentumvending, der opstår efter retracementet, i retning af trenden.
Indikatorer:
- 20 EMA
- 50 EMA
- Heiken Ashi
- MACD
- Hurtig EMA: 17
- Langsom EMA: 31
- MACD SMA: 14
Foretrukne tidsrammer: 15-minutters, 30-minutters, 1-timers og 4-timers diagrammer
Valuta Par: FX majors, mindreårige og krydsninger
Handelssessioner: Tokyo, London og New York sessioner
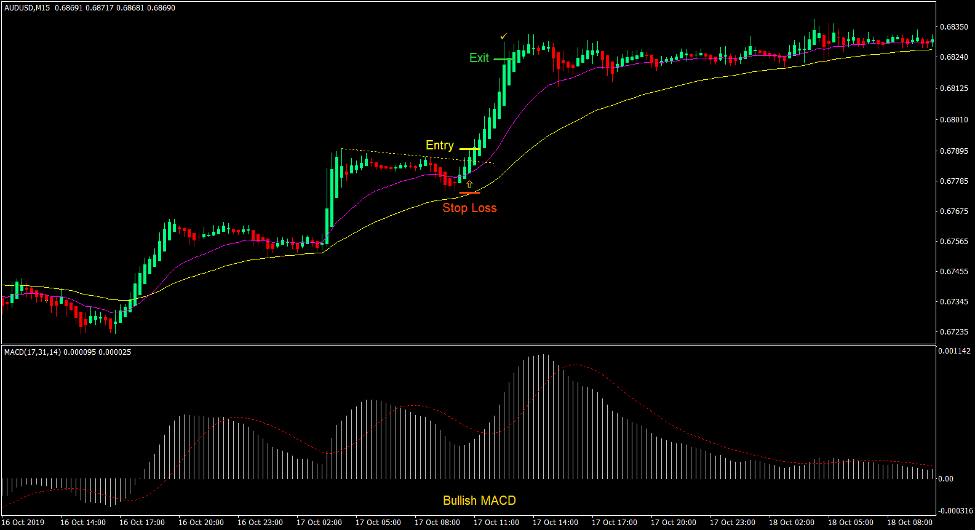
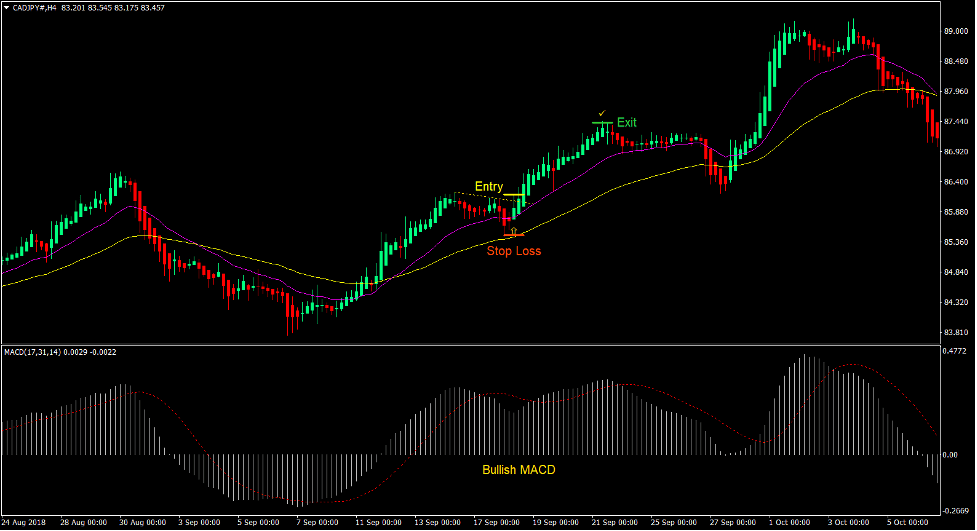
Køb Trade Setup
Indgang
- 20 EMA-linjen skal være over 50 EMA-linjen.
- MACD-bjælkerne og signallinjen skal være positive.
- Prisen bør gå tilbage mod området af 20 EMA-linjen.
- Der skal dannes en modstandslinje.
- Prisen bør bryde over modstandslinjen.
- Heiken Ashi lysestagerne skal skifte til grøn.
- Placer en købsstopordre over højden af Heiken Ashi lysestagen.
Stop Loss
- Indstil stop loss på støtten under indgangslyset.
Udgang
- Sæt take-profit-målet til 2x risikoen på stop loss.
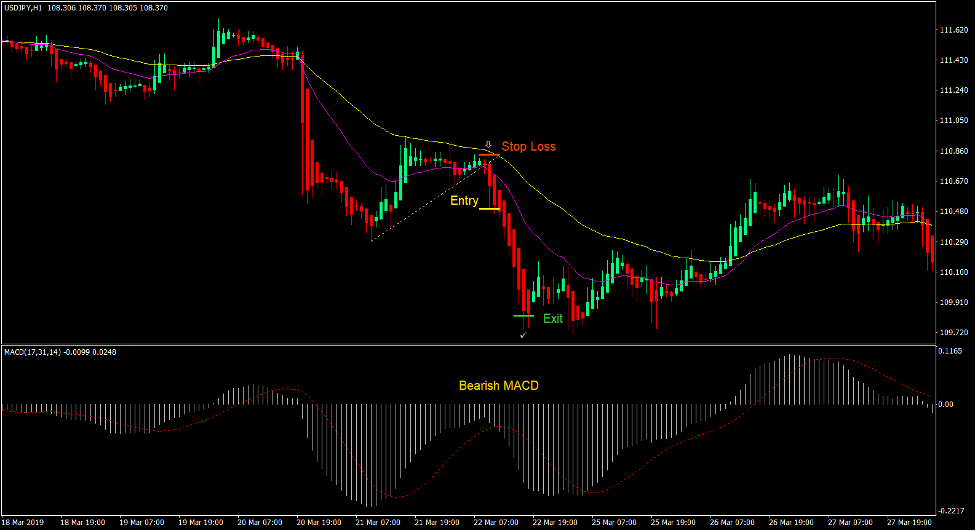
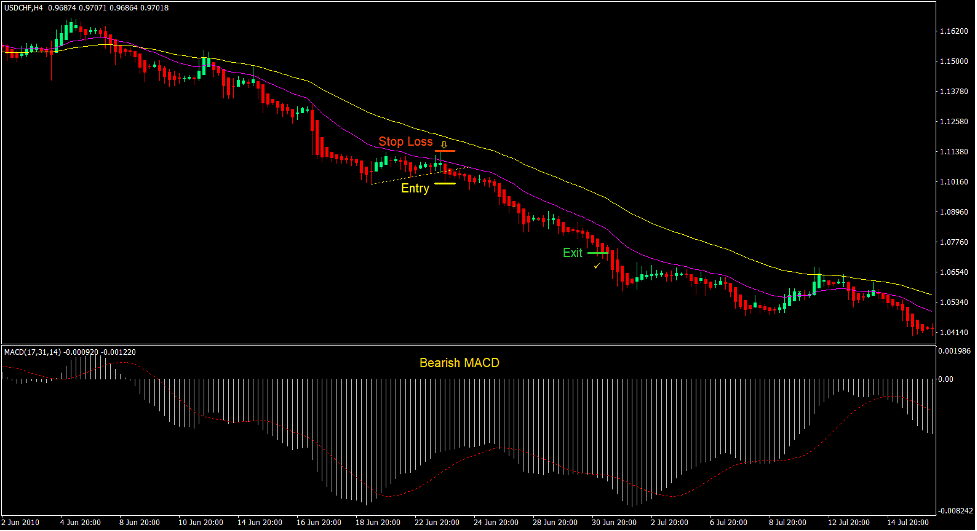
Sælg handelsopsætning
Indgang
- 20 EMA-linjen skal være under 50 EMA-linjen.
- MACD-stængerne og signallinjen skal være negative.
- Prisen bør gå tilbage mod området af 20 EMA-linjen.
- Der skal dannes en støttelinje.
- Prisen bør bryde under støttelinjen.
- Heiken Ashi lysestagerne skal skifte til røde.
- Placer en salgsstopordre under den laveste af Heiken Ashi-lysestagen.
Stop Loss
- Indstil stoptabet på modstanden over indgangslyset.
Udgang
- Sæt take-profit-målet til 2x risikoen på stop loss.
Konklusion
Denne handelsstrategi er en fungerende handelsstrategi. Hvis du ville se nøje efter, ville støtte- eller modstandslinjerne, der dannes under en retracement, normalt være en del af et flagmønster. Flagmønstre er højsandsynlige trendfortsættelsesmønstre. Det kan dog vise sig at være meget vanskeligt at identificere disse mønstre. Ved at kombinere disse tekniske indikatorer til at danne denne skabelon, kan handlende nu lettere identificere disse forhold som udbrud lige efter en retracement, der opstår under stærke trendmarkeder.
Anbefalede MT4-mæglere
XM Broker
- Gratis $ 50 For at begynde at handle med det samme! (Tilbagetrækbar fortjeneste)
- Indbetalingsbonus op til $5,000
- Ubegrænset loyalitetsprogram
- Prisvindende Forex Broker
- Yderligere eksklusive bonusser Gennem året

>> Tilmeld dig XM Broker-konto her <
FBS mægler
- Handel 100 bonus: Gratis $100 for at kickstarte din handelsrejse!
- 100% indbetalingsbonus: Fordoble dit indskud op til $10,000, og handel med øget kapital.
- Udnyttelse op til 1: 3000: Maksimering af potentielle overskud med en af de højeste gearingsmuligheder, der findes.
- Prisen 'Bedste kundeservicemægler Asia': Anerkendt ekspertise inden for kundesupport og service.
- Sæsonbestemte kampagner: Nyd en række eksklusive bonusser og kampagnetilbud hele året rundt.

>> Tilmeld dig FBS Broker-konto her <
Klik her nedenfor for at downloade: