


Hvis du vil se på de forskellige typer handelsstrategier, vil du bemærke, at der er to fælles temaer blandt disse strategier. Strategier er enten vendingsstrategier eller fortsættelsesstrategier. De fleste strategier falder ind under en af disse klassifikationer. Nogle falder i den ene ende af spektret og nogle i den anden ende af spektret. Begge typer strategier kunne fungere meget godt, når de bruges korrekt i den rigtige markedstilstand.
Forskellige forhandlere ser forskelligt på markedet. En erhvervsdrivende kan bruge en strategi med tilbageførsel, mens en anden erhvervsdrivende kan se på det som en mulighed for en fortsættelsesstrategi. Denne kamp mellem handlende, der har positioneret deres handler til en tilbageførsel, og handlende, der har positioneret deres handler for en fortsættelse, får prisen til at bevæge sig i begge retninger. Markedet bevæger sig i den retning, hvor de fleste handlende placerer deres væddemål på. Placer din handel mod størstedelen af markedet, og du ville være på den tabende ende af markedet.
Der er dog en måde at placere dig selv lige midt i begge lejre. Traders kan handle med en strategi, som både er en fortsættelsesmulighed og en reverseringsmulighed. Markedet kan være en mulighed for en trendfortsættelsesstrategi på lang sigt og også være en middelvendende strategi på kort sigt. Handel på denne måde giver handlende mulighed for at handle med størstedelen af markedet, hvilket markant øger vindesandsynligheden for hver handel.
Carter MA
Carter MA er en tilpasset trend efter teknisk indikator, som er baseret på glidende gennemsnit. Faktisk er denne indikator sammensat af et sæt glidende gennemsnit, som er sat til forskellige periodelængder.
Denne indikator plotter flere glidende gennemsnit for at hjælpe handlende med at se det store billede med hensyn til trendretning. De forskellige glidende gennemsnit har forskellige periodelængder, som det henter tallene fra for at repræsentere de varierende tendenser fra kortsigtet til langsigtet.
Den solide røde linje er baseret på et 200-perioders glidende gennemsnit, som almindeligvis bruges som en langsigtet trendindikator. Den stiplede røde linje er baseret på et 100-perioders glidende gennemsnit, som repræsenterer den mellemlange langsigtede tendens. Den blå linje er baseret på et 50-perioders glidende gennemsnit, som i vid udstrækning bruges som en mellemsigtet trendindikator. Den grønne linje er baseret på et 21-perioders glidende gennemsnit, som repræsenterer en mellemlang kortsigtet tendens. Sienna-linjen er baseret på et 8-perioders glidende gennemsnit, som repræsenterer den kortsigtede trend.
Trendretningen kan identificeres baseret på, hvordan de glidende gennemsnitslinjer stables. At have de kortsigtede glidende gennemsnit over de længerevarende glidende gennemsnit indikerer en bullish trendbias. At have de kortsigtede glidende gennemsnit under de længerevarende glidende gennemsnit indikerer en bearish trendbias. Glidende gennemsnit, der krydser hinanden, indikerer, at markedet kan vende. Glidende gennemsnit, der ikke er tydeligt stablet, indikerer et marked, der varierer, eller et marked, der bevæger sig uregelmæssigt.
Stokastisk krydsadvarsel
Standard stokastisk oscillator er en populær momentumindikator, som plotter to linjer, der svinger fra 0 til 100. Momentumretningen identificeres ud fra, hvordan de to linjer overlapper hinanden. Et bullish momentum identificeres, hvis den hurtigere linje er over den langsommere linje. Omvendt identificeres et bearish momentum, hvis den hurtigere linje er under den langsommere linje. Krydsninger mellem de to linjer fortolkes derefter som impulsomvendingssignaler.
Rækkevidden af den Stokastiske Oscillator har også typisk markører på niveau 20 og 80. Linjer, der falder til under 20, indikerer et oversolgt marked, mens linjer, der overskrider 80, indikerer et overkøbt marked. Begge betingelser er primære for gennemsnitlige reverseringer. Overkrydsninger, der forekommer på disse områder, er højsandsynlige middelvendingssignaler.
Den Stokastiske Krydsalarmindikator er en signalindikator baseret på det gennemsnitlige reverseringskoncept for den Stokastiske Oscillator. Den identificerer middel-reverseringssignaler baseret på crossovers, der forekommer under 20 eller over 80. Den plotter derefter en pil, der peger retningen af den gennemsnitlige reversering, som forhandlere kan bruge som et middel-vendingsopsætningsindgangssignal.
Trading Strategi
Carter MA Forex Trading Strategi er en kombination af en trendfølgende strategi og en gennemsnitlig vendingsstrategi.
I denne strategi identificeres trendretning baseret på, hvordan de glidende gennemsnit er stablet. Glidende gennemsnit bør også begynde at vifte ud, hvilket indikerer, at tendensen er ved at styrke sig.
Så venter vi på prisfald.
Pristilbagetrækninger kan få sienna-linjen til midlertidigt at krydse den grønne linje. Prishandlingen bør dog respektere den blå linje som en dynamisk støtte eller modstand.
Tilbagetrækningen skulle så få den stokastiske oscillator til at blive overkøbt eller oversolgt. Handler bekræftes, så snart den Stokastiske Cross Alert-indikator plotter en pil, der angiver genoptagelsen af trenden.
Indikatorer:
- Carter_MA
- Stokastisk_Cross_Alert
Foretrukne tidsrammer: 30-minutters, 1-timers og 4-timers diagrammer
Valuta Par: FX majors, mindreårige og krydsninger
Handelssessioner: Tokyo, London og New York sessioner
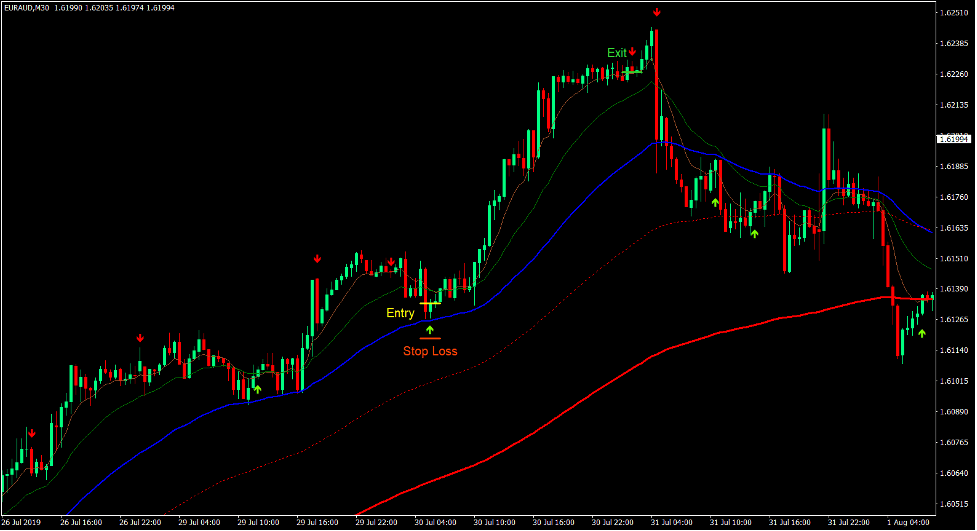
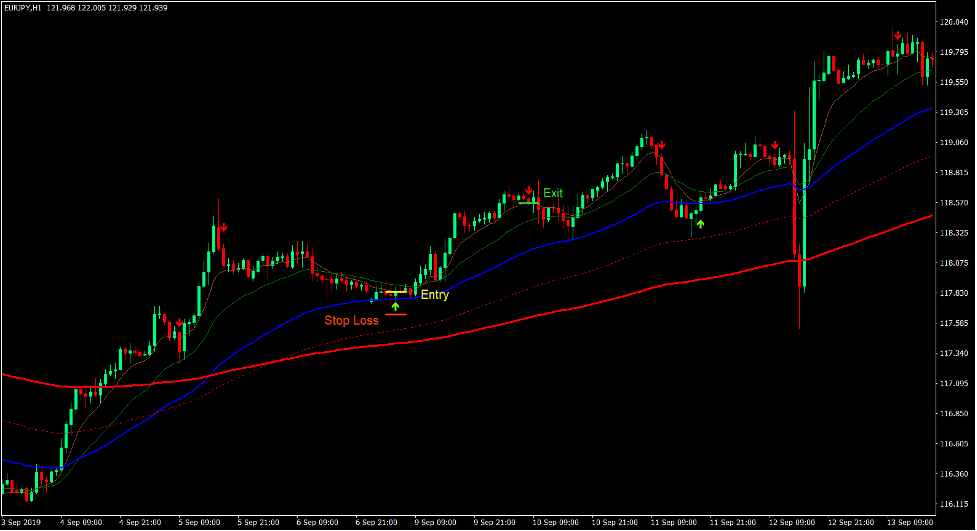
Køb Trade Setup
Indgang
- De kortsigtede glidende gennemsnitslinjer i Carter MA bør være over de længerevarende glidende gennemsnitslinjer.
- Prishandlingen skal være over den blå glidende gennemsnitslinje.
- Prisen bør trække sig tilbage mod området af den blå glidende gennemsnitslinje.
- Indtast en købsordre, så snart Stochastic Cross Alert-indikatoren plotter en pil, der peger opad.
Stop Loss
- Indstil stop loss under pilen.
Udgang
- Luk handlen, så snart Stokastisk Krydsalarm-indikatoren plotter en pil, der peger nedad.
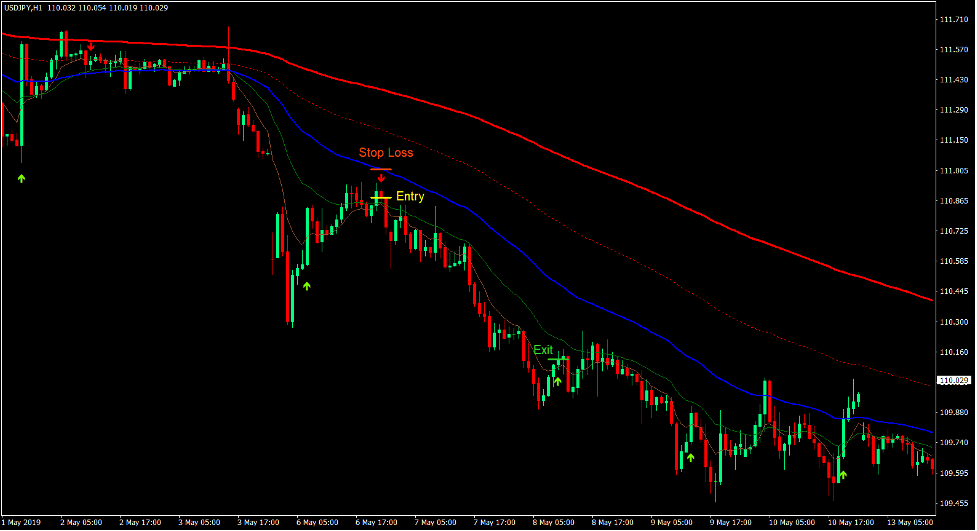
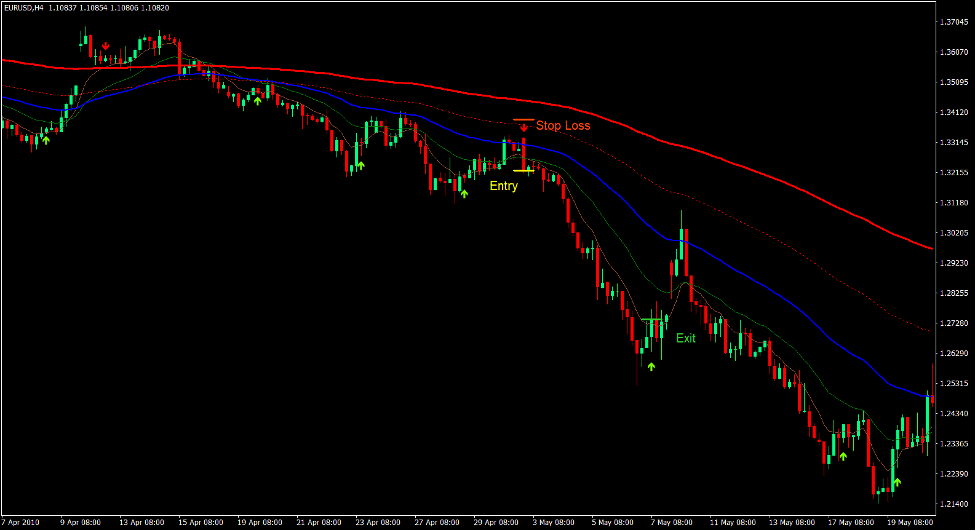
Sælg handelsopsætning
Indgang
- De kortsigtede glidende gennemsnitslinjer i Carter MA bør være under de længerevarende glidende gennemsnitslinjer.
- Prishandling bør være under den blå glidende gennemsnitslinje.
- Prisen bør trække sig tilbage mod området af den blå glidende gennemsnitslinje.
- Indtast en salgsordre, så snart Stochastic Cross Alert-indikatoren plotter en pil, der peger nedad.
Stop Loss
- Indstil stop loss over pilen.
Udgang
- Luk handlen, så snart Stokastisk Krydsalarm-indikatoren viser en pil, der peger opad.
Konklusion
Denne handelsstrategi er en fremragende handelsstrategi, fordi den kombinerer både en trendfølgende strategi og en gennemsnitlig vendingsstrategi.
Denne handelsstrategi bør bruges på et marked, der trender stærkt på lang sigt. Prisen bør også respektere 50-perioders glidende gennemsnitslinje for at bekræfte, at markedet stadig er i trend og ikke skyldes en dyb vending.
Handelsopsætninger bør forekomme nær området mellem de grønne og blå linjer, da dette område skal fungere som et område med dynamisk støtte eller modstand.
Hvis den bruges i den rigtige markedstilstand, har denne strategi potentialet til at producere ensartet overskud på lang sigt.
Anbefalede MT4-mæglere
XM Broker
- Gratis $ 50 For at begynde at handle med det samme! (Tilbagetrækbar fortjeneste)
- Indbetalingsbonus op til $5,000
- Ubegrænset loyalitetsprogram
- Prisvindende Forex Broker
- Yderligere eksklusive bonusser Gennem året

>> Tilmeld dig XM Broker-konto her <
FBS mægler
- Handel 100 bonus: Gratis $100 for at kickstarte din handelsrejse!
- 100% indbetalingsbonus: Fordoble dit indskud op til $10,000, og handel med øget kapital.
- Udnyttelse op til 1: 3000: Maksimering af potentielle overskud med en af de højeste gearingsmuligheder, der findes.
- Prisen 'Bedste kundeservicemægler Asia': Anerkendt ekspertise inden for kundesupport og service.
- Sæsonbestemte kampagner: Nyd en række eksklusive bonusser og kampagnetilbud hele året rundt.

>> Tilmeld dig FBS Broker-konto her <
Klik her nedenfor for at downloade: