


Internettet er oversvømmet med handlende, der poster handler efter kendsgerningen, der viser, hvordan de tjente enorme summer på kort tid. Dette skaber forskellige svar fra forskellige mennesker, især nye handlende og dem, der gerne vil være handlende. Nogle ville føle sig begejstrede ved at tænke på alle mulighederne i handel. Andre vil føle sig forvirrede, fordi det er meget langt fra det, de oplever. Andre er skeptiske og tænker, at de er smarte nok til ikke at tro det. Alligevel er spørgsmålet tilbage. "Er det muligt?"
Det korte svar på dette er ja. Det er muligt, fordi alt er muligt i handel. Handlende kunne tjene så mange penge, som de vil, på få minutter, men de kan også tabe så mange penge, som de kan på samme tid. Alt kan ske i handel. Markedet kan stige, og afhængigt af hvilken retning du handler, kan du enten gå konkurs eller slå et homerun.
Der er visse markedsforhold og handelsscenarier, der er prime for sådanne slags hændelser. En type marked, der giver mulighed for så store bevægelser, er et marked, der trender stærkt. På disse typer markeder kan prisen stige i vejret når som helst.
Ofte bliver handlende efterladt uden chancen for at tage handelen og tjene penge på et så stærkt træk. Der er dog måder at handle på sådanne markeder, selv når den stærke trend allerede er begyndt. Markedet er imødekommende nok til at give handlende sådanne muligheder for at deltage i festen. Vi skal bare vide, hvordan vi får øje på disse muligheder.
Bollinger Heiken Ashi Trend Forex Trading Strategy er en af de strategier, der kunne bruges til at handle så stærke trendmarkeder. Det giver handlende mulighed for at handle, selv når markedet allerede har taget fart.
Bollinger Bands
Bollinger Bands-indikatoren er en alt i én teknisk indikator. Det kan bruges til at identificere trends, momentum, volatilitet og gennemsnitlige tilbageførsler.
Den er sammensat af tre linjer. Den midterste linje er et SMA (Simple Moving Average), normalt indstillet til 20 perioder som standard. Den har også ydre linjer, som er standardafvigelser afledt fra midterlinjen. Som standard har de ydre linjer normalt en afvigelse på 1 eller 2.
Den midterste linje af Bollinger Bands kan bruges til at identificere trendretning, ligesom en almindelig glidende gennemsnitslinje bruges. Tendenser kunne identificeres baseret på linjens hældning.
De ydre linjer kunne bruges til at identificere momentum, volatilitet og gennemsnitlige reverseringer. Momentum identificeres, når prisen lukker stærkt ud over de ydre linjer. Gennemsnitlige tilbageførsler på den anden side er angivet, når der forekommer prisafvisning på området nær de ydre linjer. Volatilitet identificeres baseret på udvidelsen og sammentrækningen af de ydre linjer.
Heiken Ashi lysestager
Heiken Ashi lysestagerne er en unik måde at se på prisbevægelser på. Heiken Ashi betyder i bund og grund gennemsnitlige stænger, og det er præcis, hvad Heiken Ashi Lysestagerne er.
Den mest populære type prisoversigt er nok de japanske lysestager. Det viser åben, tæt, høj og lav af et stearinlys, som er vital information, som handlende kan bruge. Det giver også handlende mulighed for at identificere mønstre, som kunne indikere handelssignaler baseret på reverseringer eller momentum.
Heiken Ashi lysestagerne viser prisbevægelser anderledes. Det viser også høj og lav prisbevægelser. Men i stedet for at vise den faktiske åbning og lukning af prisen, beregner den gennemsnittet af åbne, høje, lave og lukkede. Dette skaber et diagram med lysestager, der kun ændrer retning, når gennemsnitsprisen har ændret retning.
Heiken Ashi lysestagerne giver handlende mulighed for at identificere kortsigtede momentum og trendvendinger. Disse indikationer kan bruges som et ind- eller udgangssignal, der er meget lydhør over for prisbevægelser.
Trading Strategi
Denne strategi er en trendfølgende strategi, der handler på ekstremt stærke trends ved hjælp af Bollinger Bands og Heiken Ashi lysestagerne.
Først filtreres handler baseret på trendretning. For at gøre dette vil vi bruge en 50-periods Simple Moving Average (SMA). Trendretningen er baseret på hældningen af 50 SMA-linjen. Ud over dette bør handlende også visuelt identificere, om markedet er i trend. Når du handler med denne strategi, bør handlende kun kigge efter markeder, der er i kraftig trend. Disse er karakteriseret ved stejlt skrånende prishandling og glidende gennemsnitslinjer.
Denne strategi bruger Bollinger Bands helt anderledes. Det nulstiller parametrene for at skabe et stramt Bollinger-bånd. Båndene bruges derefter som et dynamisk støtte- eller modstandsområde. Hvis markedet udvikler sig stærkt, vil prisen have en tendens til at hoppe af Bollinger Band-linjerne.
Efterhånden som prisen presser sig under de stærke trendimpulser, vil Heiken Ashi lysestagens farve indikere trendens retning. I løbet af de mindre sammentræknings- eller retracementfaser vil Heiken Ashi Lysestages farve dog midlertidigt vende.
Handler tages, hvis prisen ville hoppe af Bollinger Bands-området og få Heiken Ashi-lysestagerne til at genoptage trendens farve.
Indikatorer:
- 50 SMA (grøn)
- Bollinger Bands
- Periode: 10
- Afvigelser: 0.5
- Heiken Ashi (standardindstilling)
Foretrukne tidsrammer: 5-minutters, 15-minutters, 30-minutters, 1-timers og 4-timers diagrammer
Valuta Par: dur og mol par
Handelssessioner: Tokyo, London og New York sessioner
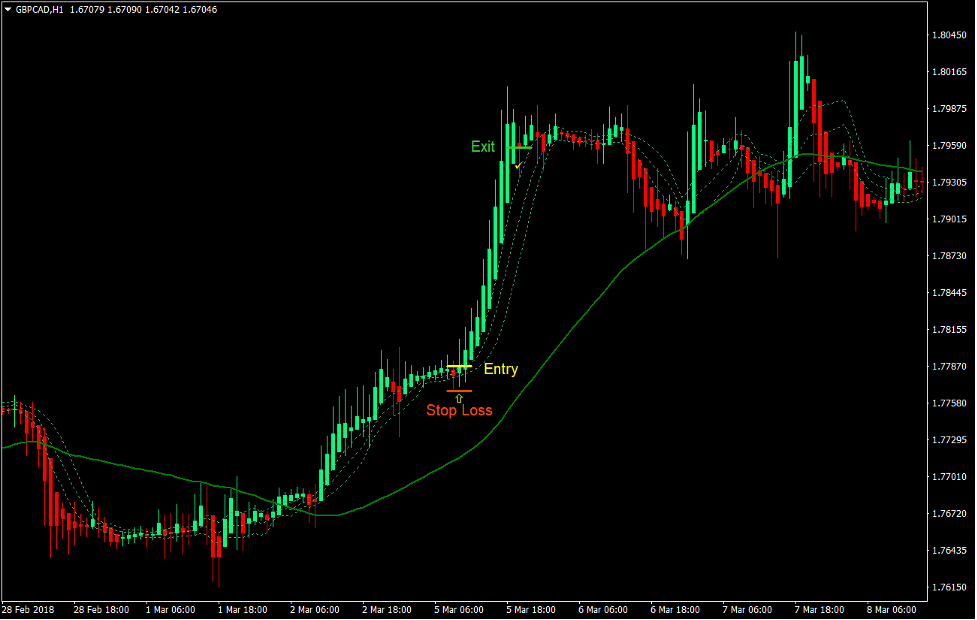
Køb Trade Setup
Indgang
- Prisen skal være over 50 SMA-linjen.
- 50 SMA-linjen skulle hælde opad.
- Prisen burde skubbe over Bollinger Band-linjerne.
- Heiken Ashi lysestagerne skal være forårsgrønne.
- Prisen skulle gå igen, hvilket får Heiken Ashi lysestagerne til midlertidigt at skifte til røde.
- Prisen bør hoppe af Bollinger Band-linjerne.
- Heiken Ashi lysestagerne skal skifte tilbage til forårsgrønne.
- Indtast en købsordre på bekræftelsen af disse betingelser.
Stop Loss
- Indstil stop loss på fraktalen under indgangslyset.
Udgang
- Luk handlen, så snart Heiken Ashi lysestagerne skifter til røde.
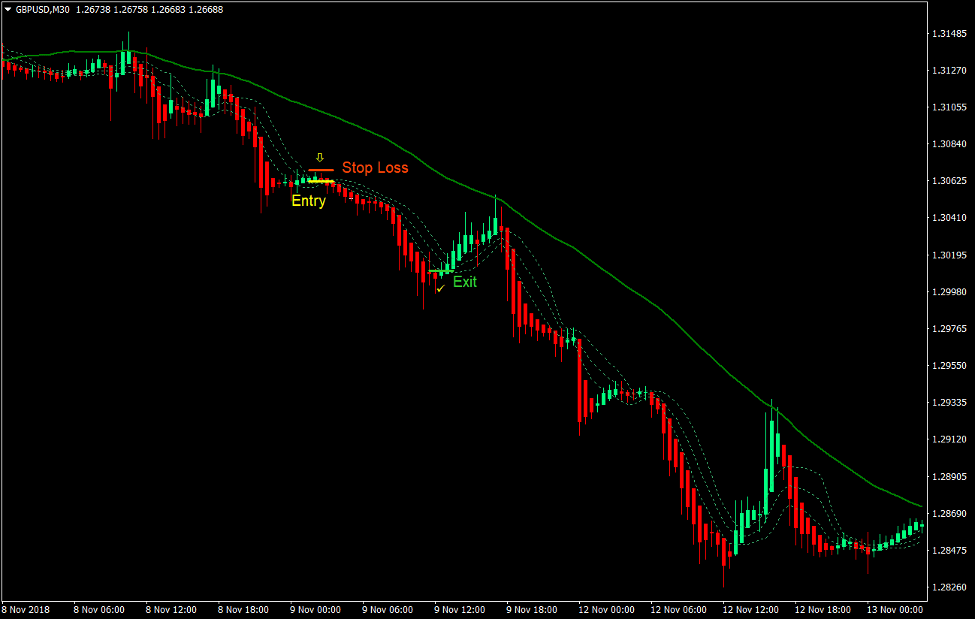
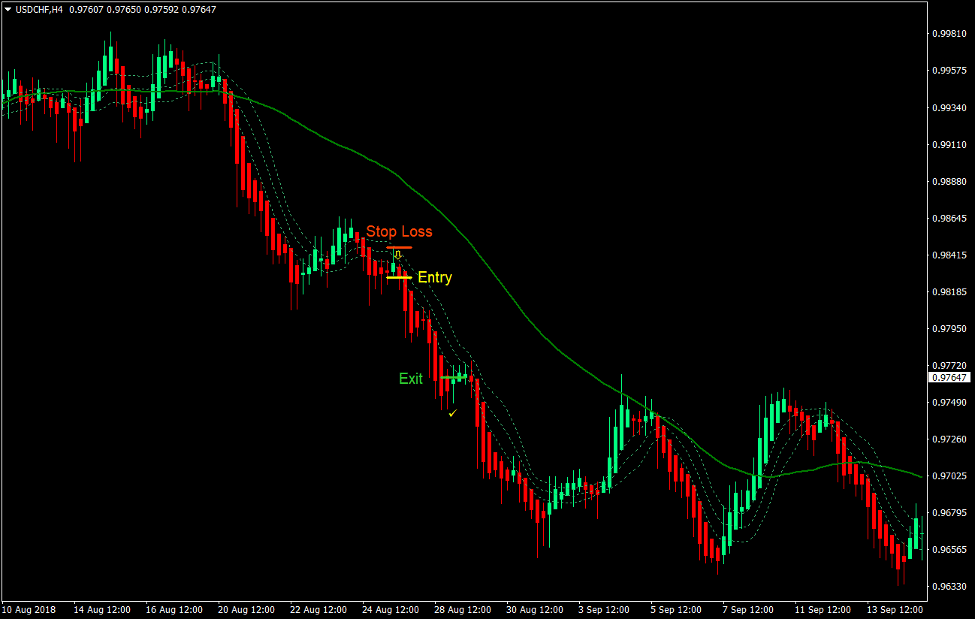
Sælg handelsopsætning
Indgang
- Prisen skal være under 50 SMA-linjen.
- 50 SMA-linjen skal hælde nedad.
- Prisen burde skubbe under Bollinger Band-linjerne.
- Heiken Ashi lysestagerne skal være røde.
- Prisen skulle gå tilbage, hvilket får Heiken Ashi lysestagerne til midlertidigt at skifte til forårsgrøn.
- Prisen bør hoppe af Bollinger Band-linjerne.
- Heiken Ashi lysestagerne skal skifte tilbage til røde.
- Indtast en salgsordre ved bekræftelsen af disse betingelser.
Stop Loss
- Indstil stoptabet på fraktalen over indgangslyset.
Udgang
- Luk handlen, så snart Heiken Ashi lysestagerne skifter til forårsgrøn.
Konklusion
Denne strategi er en handelsstrategi med højt udbytte. Handler kunne tages med tight stop loss, og vindende handler kunne få lov til at køre, så længe det kortsigtede momentum stadig er på plads. På grund af dette er det ikke ualmindeligt at se belønnings-risikoforhold så høje som 4:1.
Denne strategi kræver dog disciplin. Markeder trender ikke det meste af tiden. Handlende bør undgå at bruge denne strategi, hvis markedet ikke er i trend, eller hvis tendensen ikke er stærk nok.
Heiken Ashi Lysestager viser heller ikke den faktiske prishandling. Forhandlere kan med fordel bruge flere diagrammer, den ene med en Heiken Ashi lysestage og den anden med en standard japansk lysestage. Dette ville give handlende mulighed for at se de faktiske prisbevægelser.
Hvis den bruges i den korrekte markedstilstand, kan denne strategi gøre underværker.
Anbefalede MT4-mæglere
XM Broker
- Gratis $ 50 For at begynde at handle med det samme! (Tilbagetrækbar fortjeneste)
- Indbetalingsbonus op til $5,000
- Ubegrænset loyalitetsprogram
- Prisvindende Forex Broker
- Yderligere eksklusive bonusser Gennem året

>> Tilmeld dig XM Broker-konto her <
FBS mægler
- Handel 100 bonus: Gratis $100 for at kickstarte din handelsrejse!
- 100% indbetalingsbonus: Fordoble dit indskud op til $10,000, og handel med øget kapital.
- Udnyttelse op til 1: 3000: Maksimering af potentielle overskud med en af de højeste gearingsmuligheder, der findes.
- Prisen 'Bedste kundeservicemægler Asia': Anerkendt ekspertise inden for kundesupport og service.
- Sæsonbestemte kampagner: Nyd en række eksklusive bonusser og kampagnetilbud hele året rundt.

>> Tilmeld dig FBS Broker-konto her <
Klik her nedenfor for at downloade: