


De fleste handlende ønsker at handle på punkter, hvor markedet vender. At gøre det betyder mere overskud til den mindste risiko. Handlende, der er i stand til at fange prisen, når den vender tilbage, har en tendens til at presse mest profit ud af en prisbevægelse. Men at gøre det er meget vanskeligt at opnå.
Så hvordan fanger vi prisen på et vendepunkt? Et af de afslørende tegn på en mulig vending er prisafvisninger. Prisafvisning er ikke et egentligt begreb i handel. Jeg vil dog beskrive det som et punkt på prisdiagrammet, hvor prisen hurtigt blev vendt tilbage af markedet efter at have nået et vist niveau. Markedet afviste med andre ord hurtigt dette prisniveau, da det blev nået. Dette identificeres ved lysestager med lange væger. Dette skyldes, at lange væger indikerer, at prisen hurtigt vendte efter at have nået et vist punkt. Tilbageførslerne er så hurtige, at prisen vendte inden for en lysperiode. Det mest bemærkelsesværdige prisafvisningslysestagemønster er et nålemønster. Den lange væge og korte krop betyder, at prisen faktisk blev vendt hurtigt nok.
Prisafvisninger er meget effektive, når de observeres i nøgleområder på et prisdiagram. Disse er støtte- og modstandsniveauer, dynamiske områder af støtter og modstande, omdrejningspunkter, udbuds- og efterspørgselsområder osv.
I denne strategi vil vi se på, hvordan Bollinger Bands kan bruges til at identificere mulige tilbageførsler baseret på prisafvisning.
Bollinger Bands
Bollinger Bands er en meget brugt momentumindikator, som kan give så meget information til forskellige handlende. Det kan bruges til at identificere trendretning, volatilitet, overkøbt eller oversolgt gennemsnitsvendingssignaler og momentum breakout-signaler.
Bollinger Bands er plottet med tre linjer, der danner en kanallignende struktur. Den midterste linje er grundlæggende en 20-periods Simple Moving Average (SMA) linje. Som sådan kan den midterste linje bruges til at identificere trendretning. Dette er baseret på den generelle placering af prishandling i forhold til midterlinjen, samt hældningen af midterlinjen. Midterlinjen kan også fungere som et støtte- eller modstandsniveau, hvor prisen kan springe fra i en trendende markedstilstand.
De ydre bånd er grundlæggende standardafvigelser plottet over og under midterlinjen. Da de er baseret på standardafvigelser, kan de ydre linjer bruges til at identificere volatilitet. Et Bollinger-bånd, der er kontraheret, betyder et forex-par i en markedssammentrækningsfase, mens et Bollinger-bånd, der udvides, betyder et forex-par i en udvidelsesfase.
De ydre linjer kan også bruges til at identificere momentum breakouts, som typisk opstår efter en markedskontraktionsfase. Momentum-lys, der lukker kraftigt uden for Bollinger-båndene, indikerer et momentum-udbrud i den retning, hvor lyset brød ud fra.
Omvendt kan de samme ydre linier bruges som grundlag for et potentielt middel reverseringssignal. Dette er baseret på prishandling, der indikerer, at den afviser prisniveauet nær de ydre linjer i et Bollinger Band. Dette skyldes, at området under den nederste linje markerer et oversolgt niveau, mens området over den øverste linje markerer et overkøbt niveau. Begge betingelser er primære for gennemsnitlige reverseringer.
BB alarm pile
BB Alert Arrows-indikatoren er en brugerdefineret teknisk indikator, der fungerer som et vendingssignal. De signaler, det producerer, er baseret på nøgleområder på Bollinger Bands.
BB Alert Arrows-indikatoren registrerer gennemsnitlige vendingssignaler baseret på prishandling, der hurtigt vender tilbage fra de ydre linjer i Bollinger Bands. Den registrerer også afvisninger fra midterlinjen, mens den fungerer som et dynamisk støtte- eller modstandsniveau.
I begge scenarier plotter indikatoren blot en pil, der peger i retningen af vendingen. Handlende kan simpelthen bruge disse signaler til at træffe handelsbeslutninger.
Trading Strategi
Denne handelsstrategi er en tilbageførselshandelsstrategi, der initieres af en gennemsnitlig tilbageførsel, der kommer fra en overkøbt eller oversolgt markedstilstand.
Først identificerer vi den langsigtede tendens ved hjælp af 200 Exponential Moving Average (EMA)-linjen. Trendretning er baseret på den generelle placering af prishandling i forhold til 200 EMA-linjen, samt hældningen af nævnte linje.
Derefter gør vi brug af Bollinger Bands til at identificere overkøbte eller oversolgte markedsforhold. Dette er baseret på prishandling, der viser tegn på prisafvisning på de ydre linjer af Bollinger Bands. BB Alert-pilene bør derefter bekræfte en sådan prisafvisning ved at plotte en pil, der peger i retning af vendingen. Dette ville tjene som et gyldigt handelssignal.
Indikatorer:
- BBalert_Arrows
- Bollinger Bands
- 200 EMA
Foretrukne tidsrammer: 30-minutters, 1-timers, 4-timers og daglige diagrammer
Valuta Par: FX majors, mindreårige og krydsninger
Handelssessioner: Tokyo, London og New York sessioner
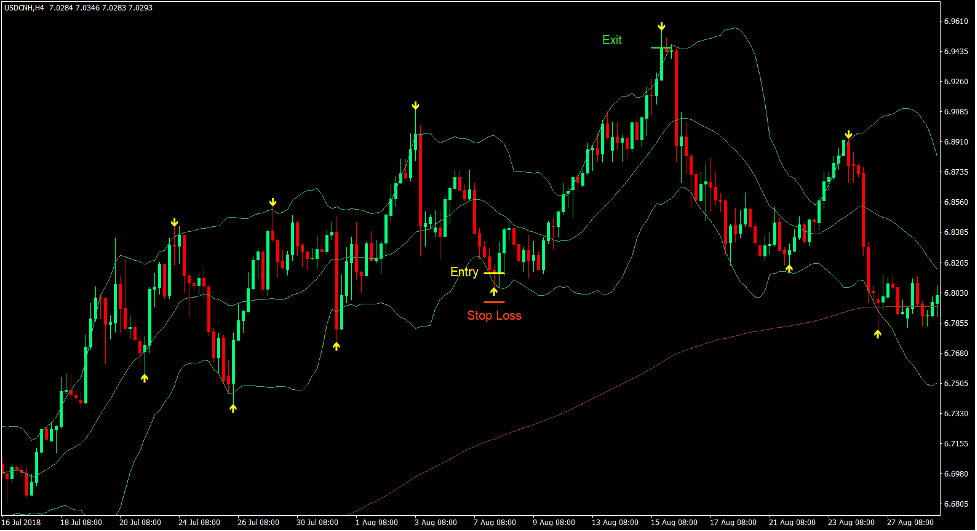
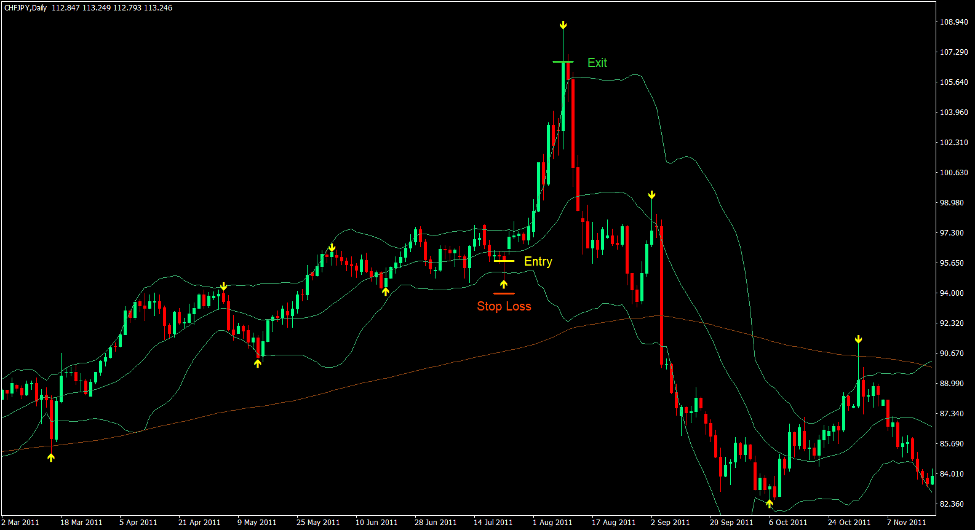
Køb Trade Setup
Indgang
- Prishandling bør være over 200 EMA-linjen.
- 200 EMA-linjen skulle hælde opad.
- Prishandling bør vise tegn på prisafvisning på området, der berører det nederste ydre Bollinger-bånd.
- BB Alert-pilene skal plotte en pil, der peger opad.
- Indtast en købsordre på bekræftelsen af disse betingelser.
Stop Loss
- Indstil stop loss under pilen.
Udgang
- Luk handelen, så snart BB Alert-pilene plotter en pil, der peger nedad.
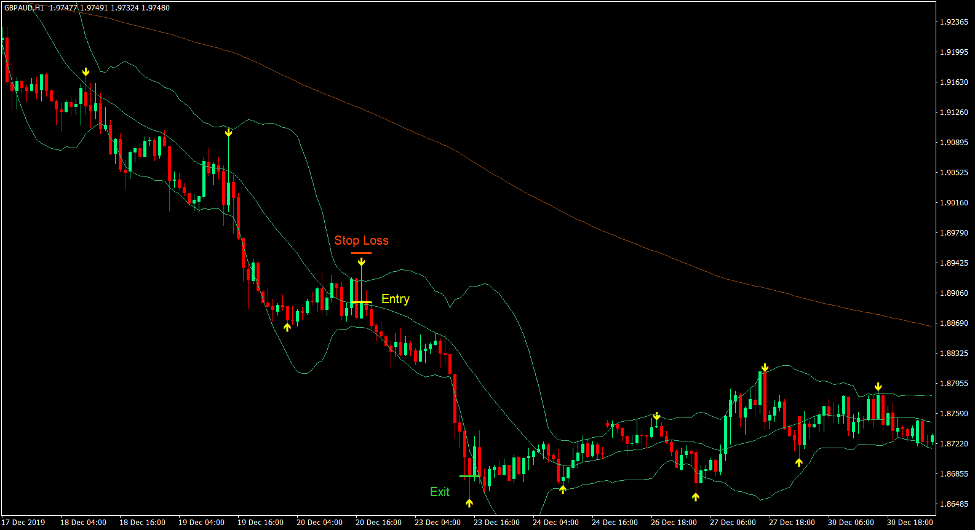
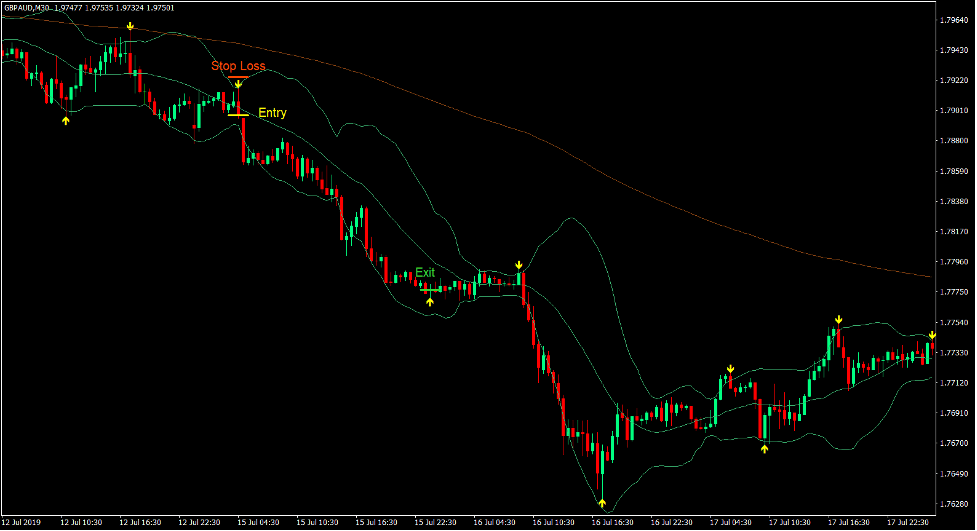
Sælg handelsopsætning
Indgang
- Prishandling bør være under 200 EMA-grænsen.
- 200 EMA-linjen skal hælde nedad.
- Prishandling bør vise tegn på prisafvisning på området, der berører det øvre ydre Bollinger-bånd.
- BB Alert-pilene skal plotte en pil, der peger nedad.
- Indtast en salgsordre ved bekræftelsen af disse betingelser.
Stop Loss
- Indstil stop loss over pilen.
Udgang
- Luk handelen, så snart BB Alert-pilene plotter en pil, der peger opad.
Konklusion
Gennemsnitlige vendingssignaler, som kan blive til potentielle, fuldstændige trendvendinger, er gode handelsmuligheder. Det er dog meget vanskeligt at få øje på disse vendingspunkter.
Brugen af Bollinger Bands som et middel til at identificere potentielle reverseringspunkter er populær blandt mange handlende. Faktisk bruger mange profitable handlende denne metode. De fleste bruger deres viden om lysestagemønstre til deres mavefornemmelse til at træffe beslutninger. Nye forhandlere har dog stadig ikke denne færdighed.
Denne strategi giver nye handlende mulighed for systematisk at identificere sådanne vendingspunkter, hvilket gør det lettere for dem at handle.
Anbefalede MT4-mæglere
XM Broker
- Gratis $ 50 For at begynde at handle med det samme! (Tilbagetrækbar fortjeneste)
- Indbetalingsbonus op til $5,000
- Ubegrænset loyalitetsprogram
- Prisvindende Forex Broker
- Yderligere eksklusive bonusser Gennem året

>> Tilmeld dig XM Broker-konto her <
FBS mægler
- Handel 100 bonus: Gratis $100 for at kickstarte din handelsrejse!
- 100% indbetalingsbonus: Fordoble dit indskud op til $10,000, og handel med øget kapital.
- Udnyttelse op til 1: 3000: Maksimering af potentielle overskud med en af de højeste gearingsmuligheder, der findes.
- Prisen 'Bedste kundeservicemægler Asia': Anerkendt ekspertise inden for kundesupport og service.
- Sæsonbestemte kampagner: Nyd en række eksklusive bonusser og kampagnetilbud hele året rundt.

>> Tilmeld dig FBS Broker-konto her <
Klik her nedenfor for at downloade: