


هناك عاملان نفسيان يلعبان بعقل المتداول عندما يتداول في سوق الفوركس. أحدهما الجشع والآخر هو الخوف. في حين أن معظم المتداولين يلومون الجشع على التسبب في خسارة الأموال عند التداول ، فإن الخوف يضر بنفس القدر بحساب المتداول.
يعرف المتداولون المتمرسون أن الأرباح والخسائر أمر مفروغ منه عند التداول في السوق. في كثير من الأحيان ، يخسر المتداولون أموالهم بسبب الجشع ، مما يؤدي في كثير من الأحيان إلى الخروج من خطة لعبهم. ومع ذلك ، فإن المتداولين المنضبطين يخسرون المال ليس بسبب الجشع ولكن فقط لأن السوق هو السوق ويقوم بكل ما يريد القيام به. كل ذلك جزء من إحصائيات استراتيجيته أو استراتيجيتها. ومع ذلك ، في بعض الأحيان لا يمكن للمتداولين التعافي من خسائرهم ، وهو جزء من الإحصائيات ، لأنهم يخشون القيام بصفقات كان من الممكن أن تكسبهم أرباحًا. كل هذا بسبب الخوف.
إحدى الفرص الواضحة التي يفوتها المتداولون غالبًا هي عندما يبدأ السوق في الاتجاه. يسيل لعاب العديد من المتداولين عندما يرون اتجاه السوق ، ويتمنون أن يكونوا قادرين على إجراء الصفقة في بداية الاتجاه. ومع ذلك ، خوفًا من أن هذا الاتجاه قد ينتهي قريبًا ، فإنهم يفضلون عدم المخاطرة.
تتمتع الأسواق المتداولة بإمكانيات كبيرة. يحتاج المتداولون فقط إلى معرفة كيفية دخول السوق المتجه دون محاولة مطاردة السعر.
إيشيموكو كينكو هيو
يعد Ichimoku Kinko Hyo أحد المؤشرات الفنية القليلة التي يمكن أن تدعي أنها نظام تداول كامل في حد ذاتها. هذا ممكن لأن هذا المؤشر يوفر للمتداولين نظرة ثاقبة لما يفعله السوق ، من الاتجاه طويل الأجل نزولاً إلى الاتجاه قصير الأجل وحركة السعر الفورية.
يتكون Ichimoku Kinko Hyo من عدة خطوط متوسط متحرك معدلة ، والتي تعتمد في الغالب على متوسط السعر خلال فترة معينة.
يتم حساب Tenkan-sen أو خط التحويل كمتوسط السعر خلال آخر تسع فترات. يمثل هذا الخط الاتجاه قصير المدى. يستخدم هذا الخط عادةً لتأكيد انعكاسات الاتجاه قصيرة المدى جنبًا إلى جنب مع خط Kijun-sen.
يعتمد Kijun-sen أو الخط الأساسي على متوسط السعر خلال آخر 26 فترة. يمثل هذا الخط الاتجاه قصير المدى إلى متوسط المدى. يمكن استخدام هذا الخط كنقطة وقف خسارة لاحقة لأن هذا قد يكون تحذيرًا مبكرًا لانعكاس الاتجاه المحتمل.
يُشتق Senkou Span A أو المسافة الرائدة A من وسيط Tenkan-sen و Kijun-sen الذي رسم 26 فترة للأمام.
Senkou Span B أو الخط الرئيسي B هو متوسط السعر على مدار الـ 52 فترة الماضية والمخطط لـ 26 فترة مقبلة.
يشكل Senkou Span A و B Kumo أو السحابة. يمثل Kumo اتجاه الاتجاه طويل المدى. الاتجاه طويل المدى صعودي إذا كان Senkou Span A أعلى من Senkou Span B. من ناحية أخرى ، يكون الاتجاه طويل المدى هبوطيًا إذا كان Senkou Span A أقل من Senkou Span B.
Chikou Span أو الفاصل الزمني المتأخر هو سعر إغلاق الفترات الحالية الذي تم رسمه لـ 26 فترة. يمكن استخدام هذا الخط لتحديد خصائص حركة السعر. يمكن استخدامه أيضًا لتحديد مستويات الدعم أو المقاومة المحتملة بناءً على نقاط التأرجح الخاصة به.
FBS فيشر
FBS Fisher هو نوع مذبذب من المؤشرات الفنية التي تعتمد على مفهوم التوزيع الطبيعي الغاوسي. يستمد هذا المؤشر حسابه من الحركات التاريخية لحركة السعر ويحول الأرقام إلى توزيع عادي غاوسي. يؤدي هذا إلى تطبيع تحركات الأسعار داخل نطاق مذبذب ، والذي بدوره يساعد المتداولين على تحديد أسواق ذروة البيع أو الشراء المحتملة التي يمكن أن تنعكس.
يتم رسم الأرقام الناتجة على هيئة أشرطة مدرج تكراري يمكن أن تكون موجبة أو سالبة. يقوم هذا المؤشر أيضًا بتعديل لون الأشرطة للإشارة إلى قوة دافعة محتملة أو ضعيفة.
تشير قضبان الذهب الإيجابية إلى اتجاه صعودي قوي ، بينما تشير قضبان الذهب السلبية إلى اتجاه هبوطي قوي. تشير الأعمدة الحمراء الإيجابية إلى اتجاه صعودي ضعيف ، بينما تشير أشرطة الجير السلبية إلى ضعف الاتجاه الهبوطي.
استراتيجية تداول
يمكن استخدام إستراتيجية تداول فوركس Ichimoku Fisher كإستراتيجية تتبع اتجاه طويل الأجل أو إستراتيجية إعادة دخول الاتجاه.
يتم استخدام Kumo لتحديد اتجاه الاتجاه طويل المدى بناءً على كيفية تداخل Senkou Span A و B ، بالإضافة إلى اللون المظلل في المنطقة داخل Kumo.
قد تتسبب عمليات الانسحاب في عكس Tenkan-sen و Kijun-sen مؤقتًا. يجب أن يتسبب ذلك أيضًا في انعكاس أشرطة FBS Fisher مؤقتًا.
يعتبر السوق مستمرًا في اتجاهه إذا تقاطع Tenkan-sen فوق Kijun-sen باتجاه اتجاه الاتجاه ويتقاطع FBS Fisher فوق خط الوسط ويرسم قضبان الذهب التي تشير إلى اتجاه الاتجاه. هذا من شأنه أن يشكل إعداد تداول صحيح.
المؤشرات:
- إيشيموكو كينكو هيو
- FBS فيشر
الأطر الزمنية المفضلة: 1 ساعة و 4 ساعات المخططات
أزواج العملات: العملات الرئيسية والثانوية والتقاطعات
جلسات التداول: دورات طوكيو ولندن ونيويورك
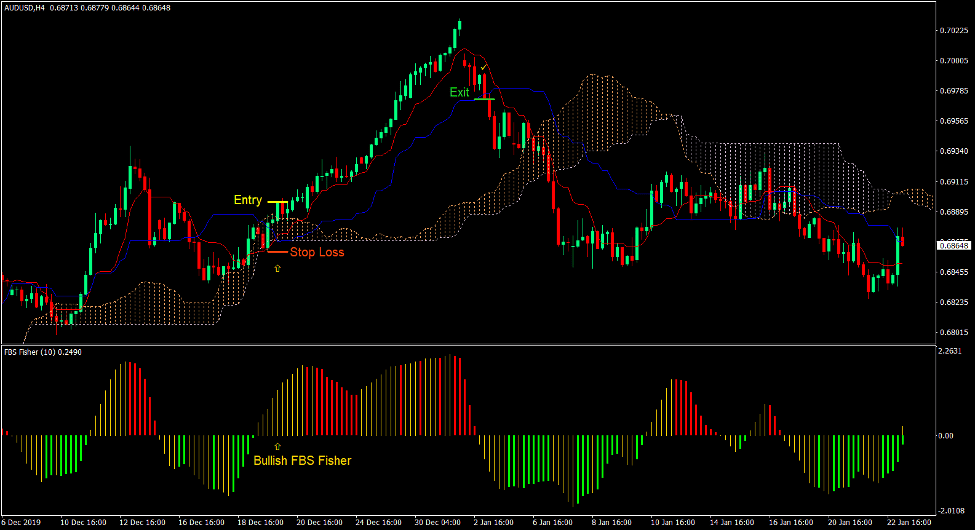
شراء إعداد التجارة
دخول
- يجب أن يكون Senkou Span A أعلى Senkou Span B ويجب أن يكون Kumo بني رملي.
- يجب أن تتجه حركة السعر لأعلى.
- يجب أن يتراجع السعر نحو Kumo مما يتسبب في عبور Tenkan-sen مؤقتًا أسفل Kijun-sen وأعمدة FBS Fisher لتكون سالبة.
- أدخل أمر شراء بمجرد أن يرسم FBS Fisher شريطًا ذهبيًا موجبًا ويتقاطع Tenkan-sen فوق Kijun-sen.
إيقاف الخسارة
- قم بتعيين وقف الخسارة على الدعم أسفل شمعة الدخول.
خروج
- أغلق الصفقة بمجرد إغلاق السعر أسفل Kijun-sen.

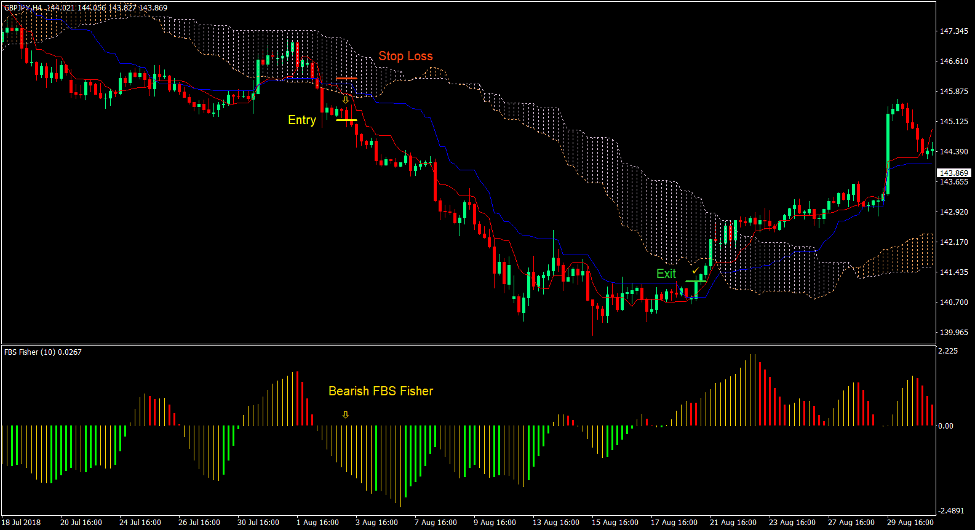
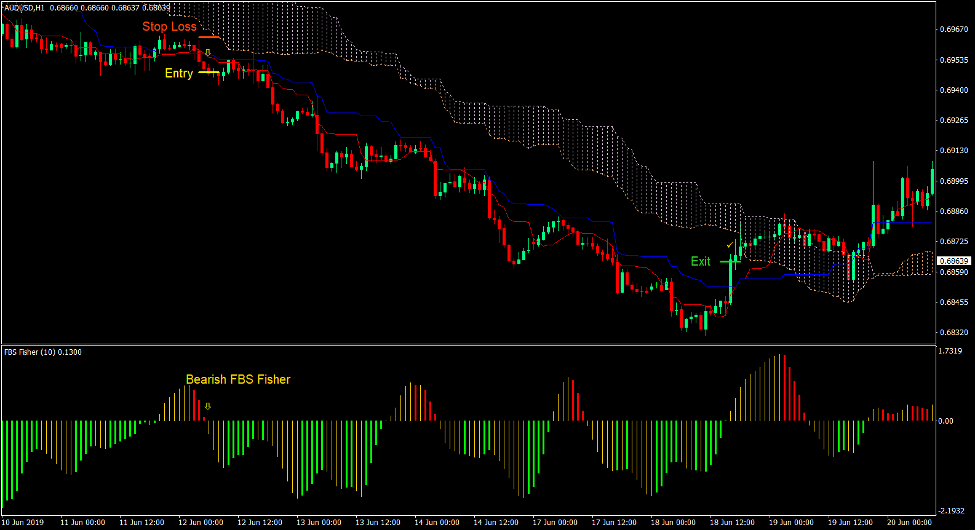
بيع إعداد التجارة
دخول
- يجب أن يكون Senkou Span A أقل من Senkou Span B ويجب أن يكون Kumo من الشوك.
- يجب أن تتجه حركة السعر للأسفل.
- يجب أن يتراجع السعر نحو Kumo مما يتسبب في عبور Tenkan-sen مؤقتًا فوق Kijun-sen و FBS Fisher لتكون قضبان إيجابية.
- أدخل أمر بيع بمجرد أن يرسم FBS Fisher قضيب ذهب سلبي ويتقاطع Tenkan-sen أسفل Kijun-sen.
إيقاف الخسارة
- قم بتعيين وقف الخسارة على المقاومة فوق شمعة الدخول.
خروج
- أغلق الصفقة بمجرد إغلاق السعر فوق Kijun-sen.
وفي الختام
مؤشر Ichimoku Kinko Hyo هو مؤشر يمكن أن يكون نظام تداول كامل في حد ذاته. في الواقع ، تعتبر عمليات الانتقال بين Tenkan-sen و Kijun-sen أثناء التوافق مع Kumo استراتيجية Ichimoku Kinko Hyo شائعة.
يعمل FBS Fisher كطبقة تأكيد إضافية يمكن للمتداولين استخدامها لتحسين احتمالية فوزهم. ومع ذلك ، يمكن للمتداولين أيضًا اختيار استخدام تحويل أشرطة FBS Fisher لتكون بمثابة محفز للدخول. قد تكون هذه طريقة أكثر عدوانية ولكنها قد تعني أيضًا دخولًا مبكرًا من شأنه أن يسمح للمتداولين بجني المزيد من الأرباح.
وسطاء MT4 الموصى بهم
XM Broker
- مجاني $ 50 لبدء التداول على الفور! (الربح القابل للسحب)
- مكافأة الإيداع تصل إلى $5,000
- برنامج ولاء غير محدود
- وسيط فوركس حائز على جوائز
- مكافآت حصرية إضافية على مدار العام

>> سجل للحصول على حساب وسيط XM هنا <
وسيط FBS
- تداول 100 مكافأة: 100 دولار مجانًا لبدء رحلة التداول الخاصة بك!
- 100٪ مكافأة إيداع: ضاعف إيداعك حتى 10,000 دولار وتداول برأس مال معزز.
- الرافعة المالية تصل إلى 1: 3000.: تعظيم الأرباح المحتملة باستخدام أحد أعلى خيارات الرافعة المالية المتاحة.
- جائزة "أفضل وسيط لخدمة العملاء في آسيا".: التميز المعترف به في دعم العملاء والخدمة.
- الترقيات الموسمية: استمتع بمجموعة متنوعة من المكافآت الحصرية والعروض الترويجية على مدار السنة.

>> سجل للحصول على حساب وسيط FBS هنا <
انقر هنا أدناه للتنزيل: