


تعد انعكاسات السوق فرصًا تجارية ممتازة حيث يمكن للمتداولين تحقيق أرباح من السوق. قد يجد العديد من المتداولين أن الأمر محفوف بالمخاطر خاصة وأن المتداولين غالبًا ما يتداولون مقابل اتجاه ثابت. ومع ذلك، مع احتمالات التداول الصحيحة، يمكن أن توفر استراتيجيات انعكاس السوق ميزة سوقية ممتازة يمكن للمتداولين استخدامها للاستفادة من السوق.
الإستراتيجية التي تمت مناقشتها أدناه هي مثال على إستراتيجية التداول الانعكاسي التي توفر إعدادًا تجاريًا منظمًا يعتمد على الاختلافات.
تحليل i-Spectr مؤشر OsMA
مؤشر i-Spectr Analysis OsMA هو مؤشر فني مخصص يعتمد على مؤشر مذبذب المتوسطات المتحركة (OsMA).
كما يوحي اسمه، فإن مؤشر OsMA الكلاسيكي هو مذبذب مشتق من المتوسط المتحرك لنوع آخر من مؤشرات التذبذب. المذبذب الأساسي الأكثر استخدامًا لمؤشر OsMA هو تقارب وتباعد المتوسط المتحرك (MACD).
يحتوي مؤشر OsMA على خوارزمية تحسب المتوسط المتحرك لقيم المذبذب الأساسية. ثم يقوم بحساب الفرق بين قيمة المذبذب الأساسي ومتوسطه المتحرك. ثم يتم استخدام الفرق الناتج لرسم أشرطة الرسم البياني للمذبذب أو خط المذبذب.
OsMA = قيمة المذبذب – القيمة المتوسطة المتحركة للمذبذب الأساسي
يستخدم مؤشر i-Spectr Analysis OsMA أيضًا مؤشر MACD الأساسي لحساب أشرطة OsMA الخاصة به. كما يقوم أيضًا بتعديل حساباته باستخدام المتوسط المتحرك الأسي (EMA) في جميع حساباته. يمكن للمستخدمين أيضًا تعديل متغيرات المعلمات الخاصة بـ MACD الأساسي ضمن إعدادات المؤشر. إحدى الميزات الفريدة لمؤشر OsMA هي أنه يحتوي أيضًا على عامل تجانس. يسمح هذا للمؤشر برسم التذبذبات التي تكون أكثر سلاسة مقارنةً بمؤشرات OsMA الأخرى.
يرسم مؤشر OsMA هذا أشرطة الرسم البياني لعرض تذبذباته. كما أن لديها ميزة حيث يتغير لون الأشرطة حسب اتجاه التذبذبات. يتم تلوين الأشرطة الموجبة ذات القيم المتزايدة باللون الأزرق، بينما يتم تلوين الأشرطة الموجبة ذات القيمة المتناقصة باللون الأخضر. يتم تلوين الأشرطة السالبة ذات القيم المتناقصة باللون الأرجواني، بينما يتم تلوين الأشرطة السالبة ذات القيم المتزايدة باللون الأرجواني. تتيح هذه الميزة للمستخدمين التعرف بسهولة على انعكاسات الزخم المحتملة، بالإضافة إلى ضعف الاتجاه أو تقويته.

الاختلافات والانعكاسات
في الرسوم البيانية للتداول والتحليل الفني، تعد الاختلافات في الأساس سيناريوهات حيث توجد انحرافات بين اتجاه أو مسار حركة السعر عند مقارنتها بمؤشر ما، وخاصة نوع المؤشر المذبذب.
على الرغم من أن الرسوم البيانية للسعر قد تبدو في كثير من الأحيان غير منتظمة دون أي اتجاه واضح، فإن المتداولين الفنيين الذين لاحظوا الرسوم البيانية للسعر يعرفون بما فيه الكفاية أن السعر يتأرجح عادة صعودا وهبوطا في النطاق السعري بطريقة تشبه الموجة. تتشكل هذه الهياكل الشبيهة بالموجة بسبب النبضات التي يصدرها السوق أثناء تحركه لأعلى ولأسفل، مما يؤدي إلى إنشاء قمم وانخفاضات تسمى قمم التأرجح وأدنى مستويات التأرجح. هذه الخاصية هي ما يشير إليه العديد من المتداولين بحركة السعر.
عادة ما تحاكي مؤشرات التذبذب تحركات حركة السعر. وهذا هو السبب في أن تذبذبات حركة السعر غالبًا ما تتماشى مع تذبذبات المؤشر الفني. ويترتب على ذلك أيضًا أن مؤشرات التذبذب عادةً ما تحاكي مسار حركة السعر. إذا كانت حركة السعر تحقق ارتفاعات أعلى وأدنى مستويات التأرجح، فإن مذبذبها المقابل عادة ما يفعل الشيء نفسه. على العكس من ذلك، إذا كانت حركة السعر تحقق ارتفاعات منخفضة وأدنى مستويات التأرجح، فيجب أن يتبع نفس المذبذب أيضًا نفس المسار.
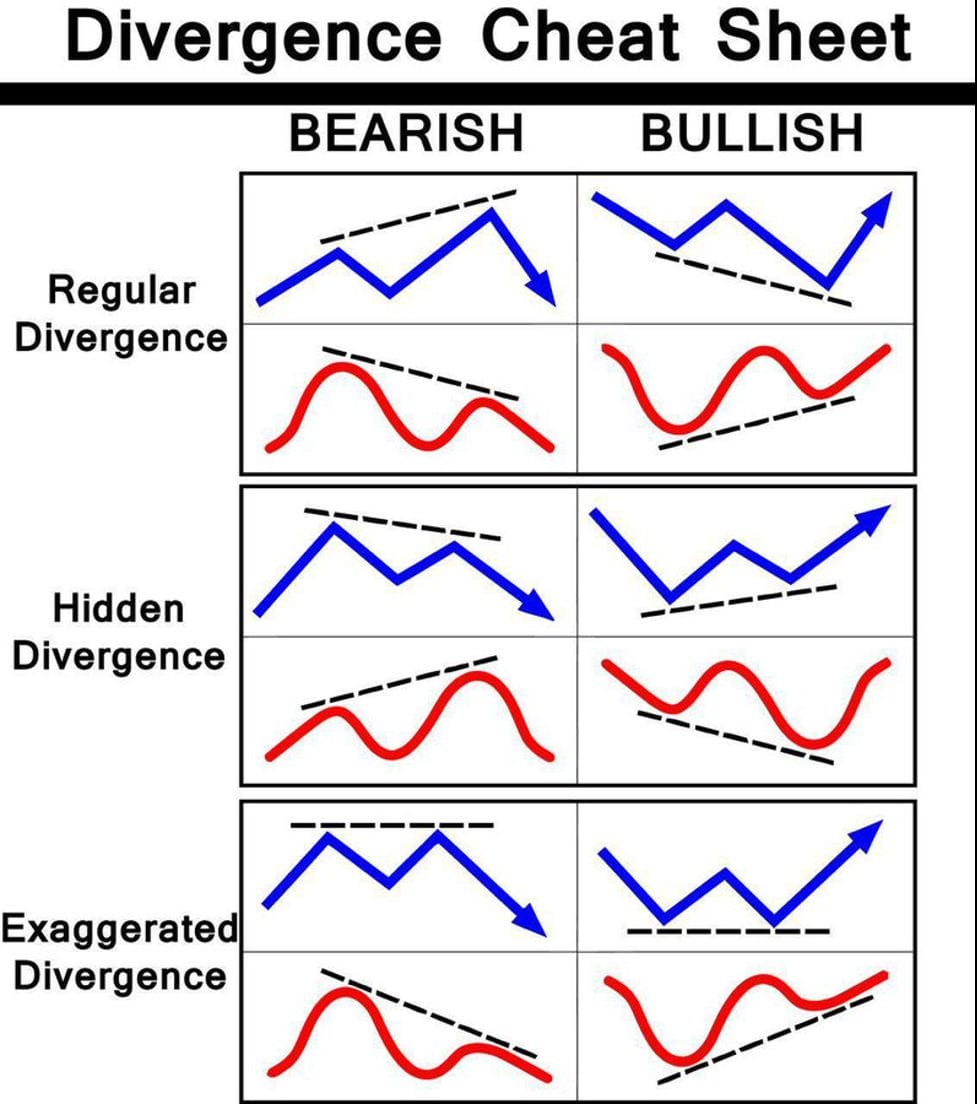
ومع ذلك، هناك حالات يختلف فيها مسار الارتفاعات والقيعان المتأرجحة لحركة السعر عن مسار المذبذب المقابل. قد تكون حركة السعر قد حققت أدنى مستوياتها، في حين أن المذبذب يحقق انخفاضات أقل أو العكس. ومن الممكن أيضًا أن تكون حركة السعر قد حققت أعلى مستويات التأرجح، في حين أن المذبذب المقابل له يحقق أعلى مستويات التأرجح أو العكس. تسمى هذه السيناريوهات "الاختلافات". تعتبر سيناريوهات السوق هذه علامات واضحة على انعكاس محتمل في السوق والذي قد يتصرف المتداولون بناءً عليه.
يوضح الرسم البياني أدناه الأنواع المختلفة من الاختلافات التي قد يستخدمها المتداولون.
مفهوم استراتيجية التداول
i-Spectr Analysis OsMA Divergence Forex Trading Strategy for MT5 هي استراتيجية تداول بسيطة لعكس الزخم والتي تستخدم الاختلافات كأساس لتحديد انعكاسات السوق المحتملة. ويستخدم مؤشر i-Spectr Analysis OsMA كأساس لتحديد الاختلافات المحتملة عند مقارنتها بحركة السعر المقابلة للأداة القابلة للتداول التي يمثلها.
يمكن للمتداولين استخدام تغيير لون الأشرطة لتحديد قمم وقيعان تذبذبات i-Spectr Analysis OsMA ومقارنتها بتذبذبات حركة السعر لتسهيل الرجوع إليها.
بمجرد تحديد الاختلاف الصحيح، يمكن للمتداولين استخدام نفس تغير اللون عند القمة الثانية أو أسفل أشرطة المذبذب كتأكيد على انعكاس الزخم.
شراء إعداد التجارة
دخول
- حدد تباعدًا صعوديًا صالحًا من خلال مقارنة أدنى مستويات التأرجح لحركة السعر مع الانخفاضات في أشرطة i-Spectr Analysis OsMA.
- قد يتم تأكيد إشارة التجارة الصعودية بمجرد تغيير لون أشرطة OsMA لتحليل i-Spectr إلى اللون الأرجواني عند الانخفاض الثاني للمذبذب.
إيقاف الخسارة
- ضع وقف الخسارة أسفل شمعة الدخول.
خروج
- قم بتعيين هدف جني الأرباح على مستوى منطقة التأرجح المرتفعة التالية فوق منطقة دخول التجارة.

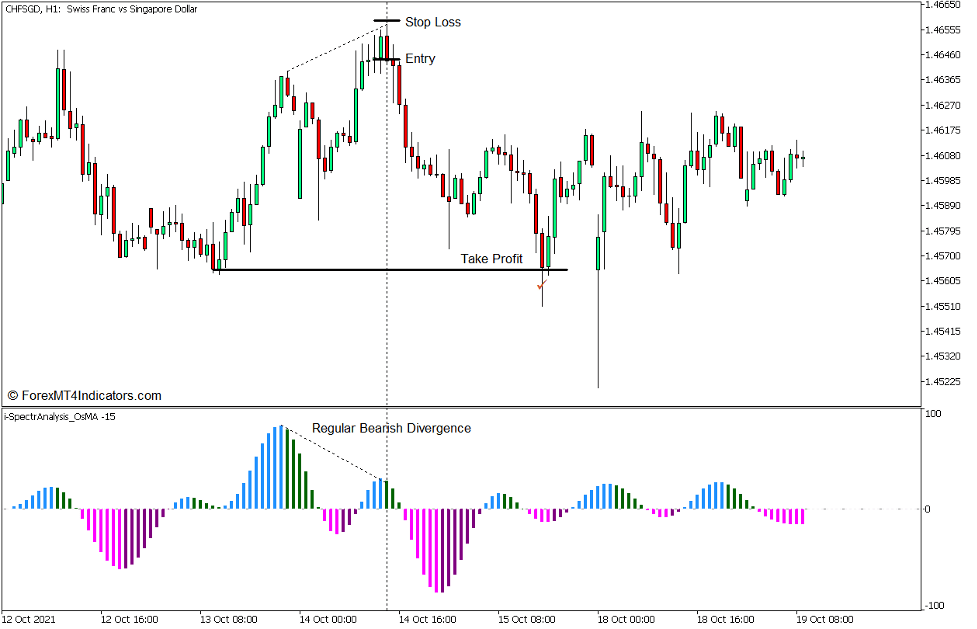
بيع إعداد التجارة
دخول
- حدد تباعدًا هبوطيًا صحيحًا من خلال مقارنة أعلى مستويات التأرجح لحركة السعر مع القمم الموجودة على أشرطة i-Spectr Analysis OsMA.
- قد يتم تأكيد إشارة التجارة الهبوطية بمجرد تغيير لون أشرطة OsMA لتحليل i-Spectr إلى اللون الأخضر عند القمة الثانية للمذبذب.
إيقاف الخسارة
- ضع وقف الخسارة فوق شمعة الدخول.
خروج
- قم بتعيين هدف جني الأرباح على مستوى المنطقة المنخفضة المتأرجحة التالية أسفل نقطة دخول التجارة.
وفي الختام
تعد الاختلافات من أكثر إشارات التجارة الانعكاسية فعالية والتي قد يستخدمها المتداولون. قد يقول العديد من المتداولين المحترفين الذين يستخدمون الاختلافات أنه غالبًا ما يؤدي إلى احتمال فوز واحد من أصل 1 صفقات. قد لا يبدو هذا كثيرًا ولكن مع نسبة المخاطرة إلى المكافأة الصحيحة، ستكون نسبة الربح هذه مربحة للغاية. السؤال هو ما هو المذبذب الذي يجب على المتداولين استخدامه.
يبدو أن مؤشر i-Spectr Analysis OsMA الذي تمت مناقشته أعلاه فعال في تحديد الاختلافات الصحيحة. ومع ذلك، ينبغي أيضًا أن يقترن بتحليل سليم لهيكل السوق وفهم جيد لحركة السعر. قد يؤدي القيام بذلك إلى تحسين إشارات التداول الخاصة بك خاصة عند استخدامها في سيناريو السوق الصحيح.
وسطاء MT5 الموصى بهم
XM Broker
- مجاني $ 50 لبدء التداول على الفور! (الربح القابل للسحب)
- مكافأة الإيداع تصل إلى $5,000
- برنامج ولاء غير محدود
- وسيط فوركس حائز على جوائز
- مكافآت حصرية إضافية على مدار العام

>> سجل للحصول على حساب وسيط XM هنا <
وسيط FBS
- تداول 100 مكافأة: 100 دولار مجانًا لبدء رحلة التداول الخاصة بك!
- 100٪ مكافأة إيداع: ضاعف إيداعك حتى 10,000 دولار وتداول برأس مال معزز.
- الرافعة المالية تصل إلى 1: 3000.: تعظيم الأرباح المحتملة باستخدام أحد أعلى خيارات الرافعة المالية المتاحة.
- جائزة "أفضل وسيط لخدمة العملاء في آسيا".: التميز المعترف به في دعم العملاء والخدمة.
- الترقيات الموسمية: استمتع بمجموعة متنوعة من المكافآت الحصرية والعروض الترويجية على مدار السنة.

>> سجل للحصول على حساب وسيط FBS هنا <
انقر هنا أدناه للتنزيل: