


Introduction to the Value Charts Indicator
The Value Charts Indicator was developed by David Stendahl to help traders identify mean reversal signals from extreme price levels. It is based on the concept explained on the book “Dynamic Trading Indicators: Winning with Value Charts and Price Action Profile” by Mark Helweg and David Stendahl.
What is the Value Charts Indicator?
The Value Charts Indicator is an oscillator type of technical indicator which indicates the direction of momentum, as well as overbought and oversold price levels.
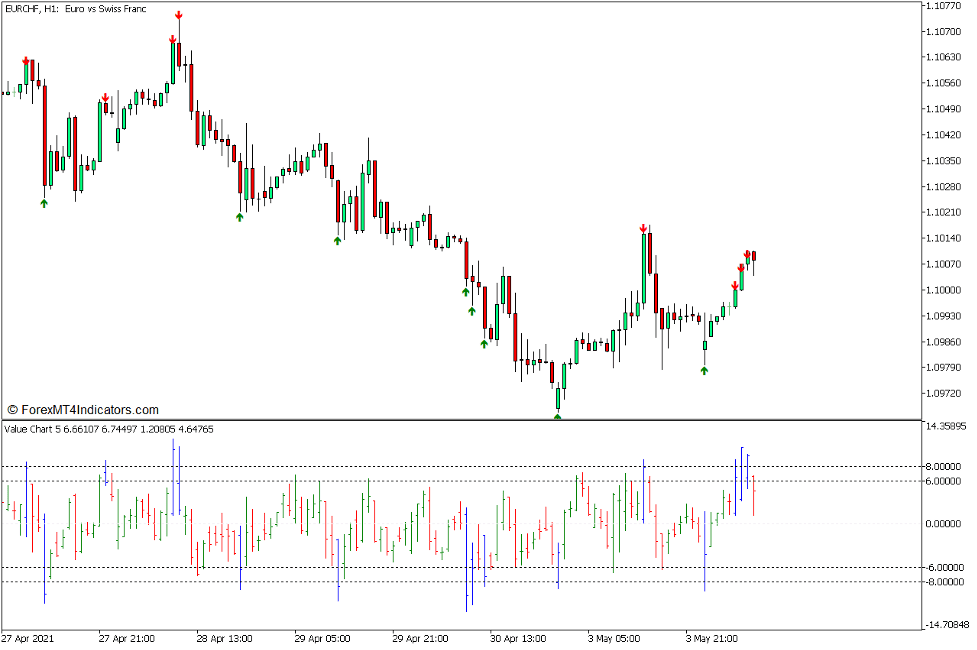
This indicator plots bars that oscillate within a range that has a normal value between -8.00 and 8.00. The bars that it plots is not exactly the same as with the regular oscillators. These bars have points which represent the average of the open, high, low, and close of the average price movements. The point corresponding to the average of the open is on the left of each bar, while the point corresponding to the close is on the right of each bar.
The colors of the bars also indicate momentum direction, as well as overbought and oversold markets. It plots green bars to indicate a bullish momentum, red bars to indicate a bearish momentum, and blue bars to indicate oversold and overbought markets.
The range of the Value Chart is also marked at levels -8.00, -6.00, 6.00, and 8.00. The normal range is between -6.00 and 6.00. However, the levels below -8.00 indicate an oversold market, while levels above 8.00 indicate an overbought market.
How the Value Charts Indicator Works?
The algorithm of the Value Charts Indicator calculates for the “Range Average” which is the average difference between the high and the low. It also calculates for the “Middle Average” which is the average of the high and the low. It then extrapolates further calculations based from the values above, which is then used to plot the range of each bar, as well as its significant points which represent the average of the open, high, low, and close.
The color of the bars changes to blue whenever the high or low of a bar breaches the -8.00 and 8.00 range. It changes to red whenever it detects a bearish momentum, and green whenever it detects a bullish momentum. It also plots reversal arrows whenever it detects a breach of the said range.
How to use the Value Charts Indicator for MT5
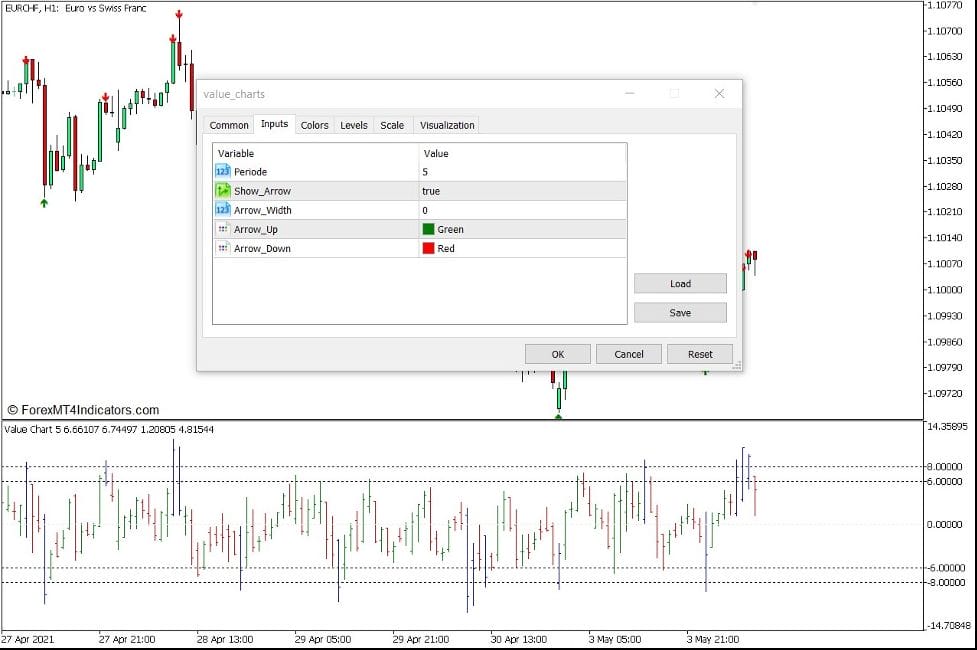
The Value Charts Indicator has a few options within its settings which can modify its characteristics.
“Periode” refers to the number of bars the indicator uses for its calculations.
“Show_Arrow” toggles the arrow signals on and off.
“Arrow_Width” modifies the size of the arrow.
“Arrow_Up” and “Arrow_Down” modifies the color of the arrow signals.
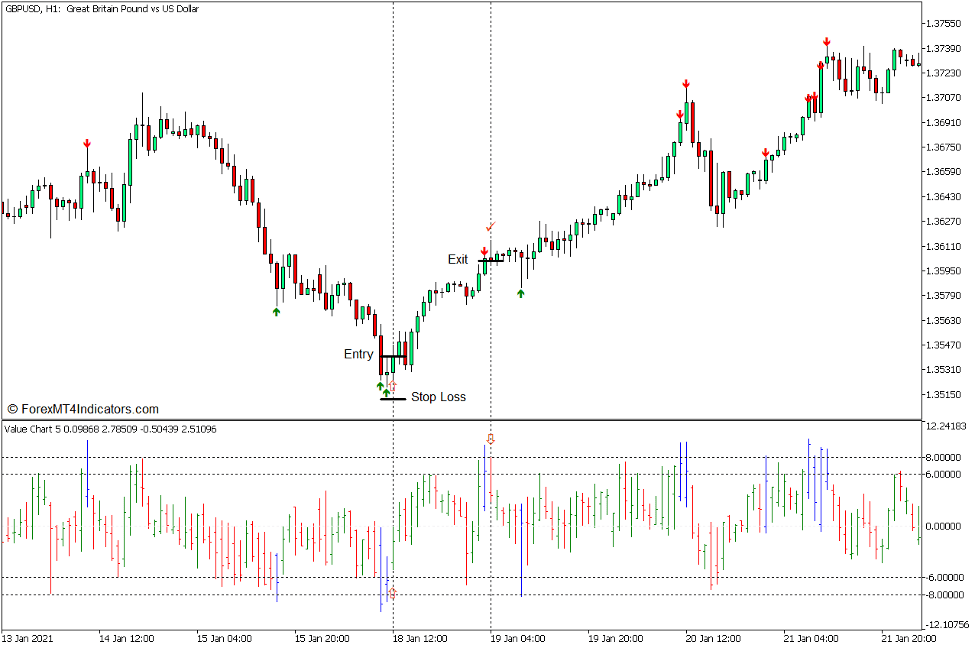
Buy Trade Setup
When to Enter?
Open a buy order as soon as a bar changes to green coming from a blue bar dropping below -8.00.
When to Exit?
Allow the bars to swing above 8.00 and close the trade as the bar changes to red.
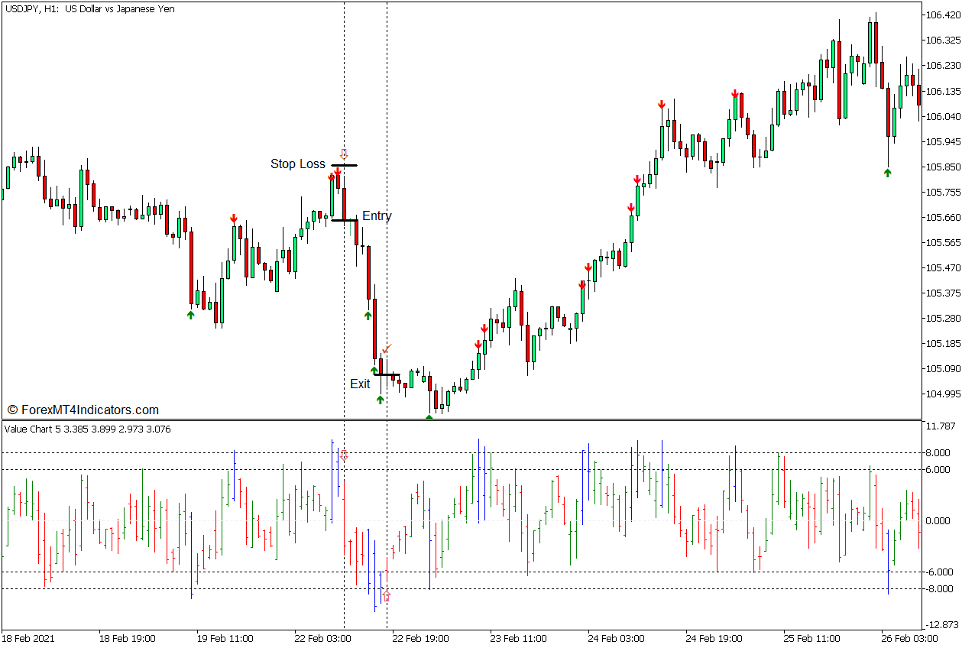
Sell Trade Setup
When to Enter?
Open a sell order as soon as a bar changes to red coming from a blue bar breaching above 8.00.
When to Exit?
Allow the bars to swing below -8.00 and close the trade as the bar changes to green.
Conclusion
This indicator is a very reliable mean reversal signal indicator. However, the signal arrows should not be used as a confirmed mean reversal signal as these signals form as the bars breach the normal range. Reversals are better based on the changing of the color coming from extreme levels.
XM Broker >> Sign Up for XM Broker Account here << FBS Broker >> Sign Up for FBS Broker Account here << Click here below to download:Recommended MT5 Brokers


(Free MT5 Indicators Download)