


Most traders prefer trading in the direction of an established trend. They would often try to identify the direction of the prevailing trend and discriminately trade only in the direction of that trend. This type of trading strategy is called a trend following strategy. Most traders prefer this style because it means that they are trading with the flow of the market and not against it.
However, there are other traders who prefer to trade only when the market reverses and forms a new trend. So, they would trade a trading strategy which should help them identify possible trend reversals. Trading in this manner is often considered risky because it means that you are trading against the previous flow of the market and are often the new market trend direction is not yet clearly established. However, it also allows traders to maximize their profits when trading in this manner. This is because they are often trading at the start of the trend and exiting at the end of a trend.
Crossover strategies are some of the most common type of trend reversal strategies. It is a simple method of trading trend reversals based on the crossing over of moving average lines. However, despite its simplicity, many traders still fail when trading crossover strategies. This is usually because they blindly follow crossover strategies without taking into consideration the characteristics and behavior of the current market condition.
TMA Momentum Cross Forex Trading Strategy helps traders identify and confirm probable trend reversals based on a set of rules using highly reliable technical indicators. It also considers the behavior of price action as well as the candlesticks itself.
Three Color MA
Three Color MA is a custom technical indicator based on moving averages.
Moving averages have two common disadvantages. One is that most moving averages are lagging. This means that most moving averages respond very late to price movements. On the other end of the spectrum are moving averages that move too erratically. These moving averages tend to move even with the slightest fluctuation in price.
Three Color MA is a modified moving average which smoothens out its moving average line making it less susceptible to false signals present in choppy markets, while at the same time making it more responsive to recent price changes.
The line plotted by the Thee Color MA indicator also changes. This allows traders to more easily identify the cycles of the market.
TMA Slope
TMA Slope is another custom technical indicator which is developed based on moving averages. It is also an oscillator type of indicator which plots bars and dots on a separate window.
The TMA Slope indicator is computed by identifying the slope of a Triangulated Moving Average (TMA) line. This is based on the difference between a fast-moving TMA line and a slower moving TMA line. The indicator then plots the difference on a separate window as histogram bars. Positive green bars indicate a bullish trend bias while negative coral bars indicate bearish trend bias.
The indicator also plots dots attached to the histogram bars. It plots aqua dots to indicate a bullish momentum and red dots to indicate a bearish momentum. Positive aqua dots indicate a strengthening bullish trend while positive red dots indicate a weakening bearish trend. On the other hand, negative red dots indicate a strengthening bearish trend while negative aqua dots indicate a weakening bearish trend.
Trading Strategy
This trading strategy is a crossover trading strategy which makes use of 30-period Exponential Moving Average (EMA) line and the Three Color MA line as a basis for its crossover trading signal.
However, instead of trading every signal that we could come across, we will filter trades based on the confluence of the crossover and the TMA Slope indicator. The crossover of the 30 EMA line and the Three Color MA line should be in confluence with the trend direction indicated by the TMA Slope indicator.
Then, we should identify high probability trade setups based on the characteristics of price action. Instead of taking the trade right after the crossover of the two lines, we will wait for price to retrace towards the area of the moving average lines. Then, we should wait for a momentum candle to move in the direction of the trend indicating that price is more likely to move towards the direction of the new trend being developed.
Indicators:
- Three_Color_MA
- 30 EMA
- Tma_slope_nrp_alerts
Preferred Time Frames: 30-minute, 1-hour, 4-hour and daily charts
Currency Pairs: FX majors, minors and crosses
Trading Sessions: Tokyo, London and New York sessions
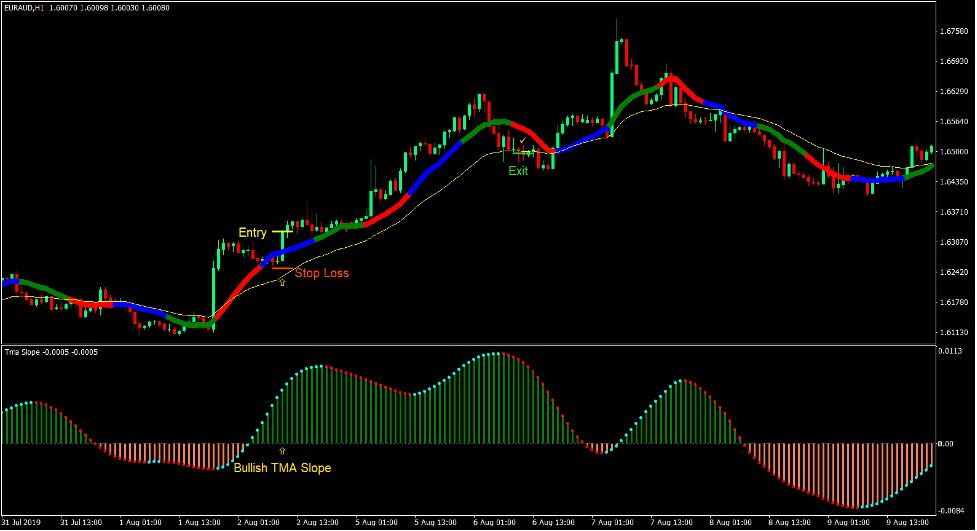
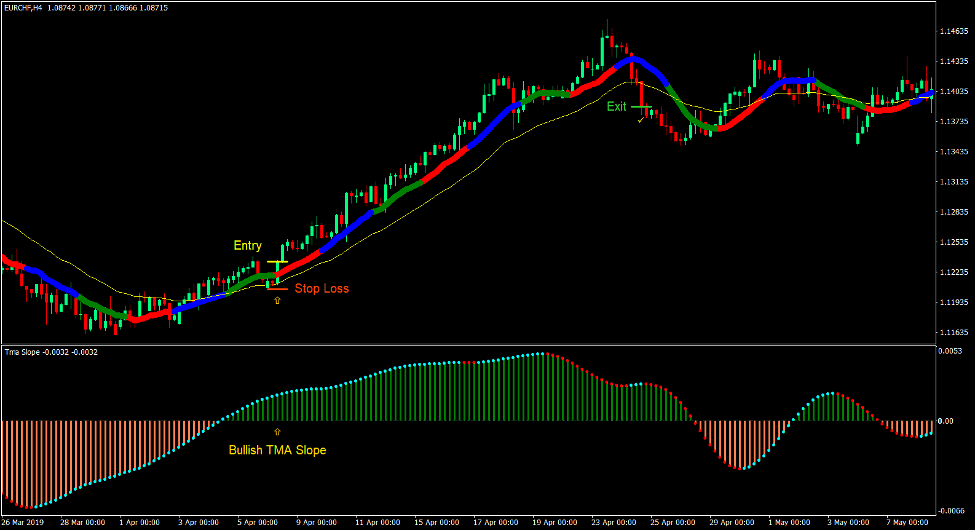
Buy Trade Setup
Entry
- Price action should cross above the 30 EMA line and the Three Color MA line.
- The TMA Slope line should become positive.
- The Three Color MA line should cross above the 30 EMA line.
- Price action should retrace towards the area of the moving average lines.
- A bullish momentum candle should be formed as price action rejects the area of the moving average lines.
- Enter a buy order on the confirmation of these conditions.
Stop Loss
- Set the stop loss on the support below the entry candle.
Exit
- Close the trade as soon as price closes below the 30 EMA line.
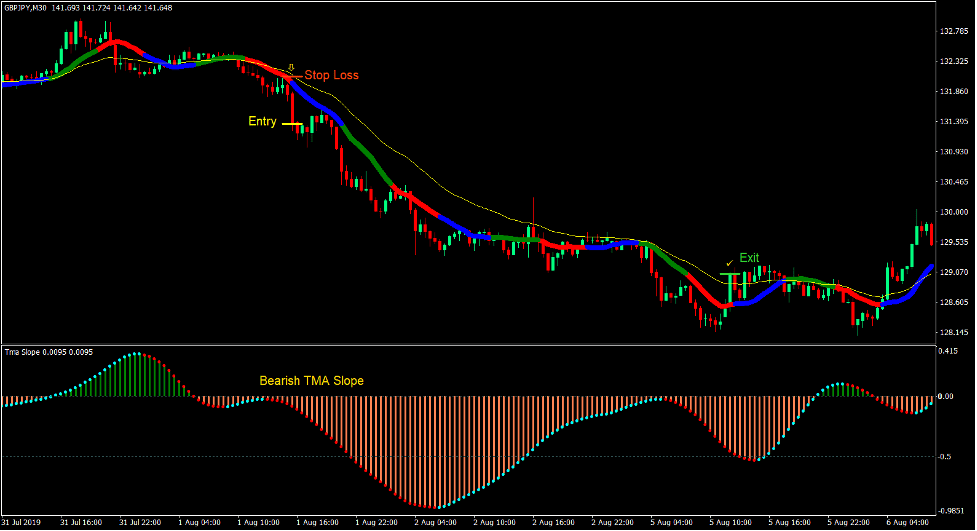
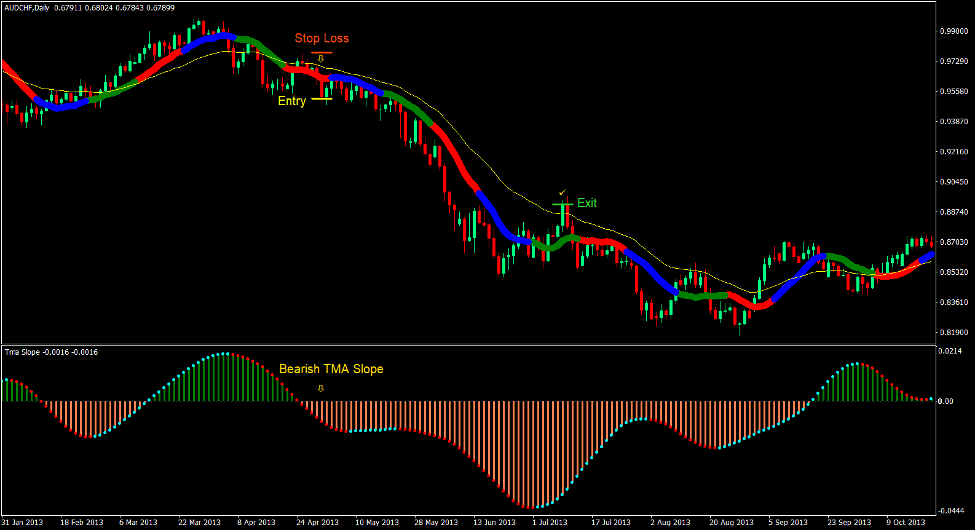
Sell Trade Setup
Entry
- Price action should cross below the 30 EMA line and the Three Color MA line.
- The TMA Slope line should become negative.
- The Three Color MA line should cross beow the 30 EMA line.
- Price action should retrace towards the area of the moving average lines.
- A bearish momentum candle should be formed as price action rejects the area of the moving average lines.
- Enter a sell order on the confirmation of these conditions.
Stop Loss
- Set the stop loss on the resistance above the entry candle.
Exit
- Close the trade as soon as price closes above the 30 EMA line.
Conclusion
This strategy makes use of several concepts which traders use to identify trend reversals. First is the crossover of the moving average lines. Then, price action, which is identified based on how price action tends to create higher highs in an uptrend and lower lows in a downtrend. This comes hand in hand with price action rejecting the area of the moving average lines. Lastly, the slope of moving average lines. The TMA Slope indicator simply helps us objectively identify the slope of the moving average lines.
By combining all three concepts, we get to have trade setups which have higher probabilities. If used in the right market condition, these trade setups would tend to produce positive results.
Recommended MT4 Brokers
XM Broker
- Free $50 To Start Trading Instantly! (Withdraw-able Profit)
- Deposit Bonus up to $5,000
- Unlimited Loyalty Program
- Award Winning Forex Broker
- Additional Exclusive Bonuses Throughout The Year

>> Sign Up for XM Broker Account here <<
FBS Broker
- Trade 100 Bonus: Free $100 to kickstart your trading journey!
- 100% Deposit Bonus: Double your deposit up to $10,000 and trade with enhanced capital.
- Leverage up to 1:3000: Maximizing potential profits with one of the highest leverage options available.
- ‘Best Customer Service Broker Asia’ Award: Recognized excellence in customer support and service.
- Seasonal Promotions: Enjoy a variety of exclusive bonuses and promotional offers all year round.

>> Sign Up for FBS Broker Account here <<
Click here below to download: