


TDI Bounce Scalping Forex Strategy
The Trader’s Dynamic Index (TDI) is an all-in-one indicator that combines many different indicators into one. This allows traders the convenience of assessing confluence of different indicators, while looking at just one window.
Its components include the Bollinger Bands, the RSI, and the moving average.
This is how a regular TDI indicator looks like.
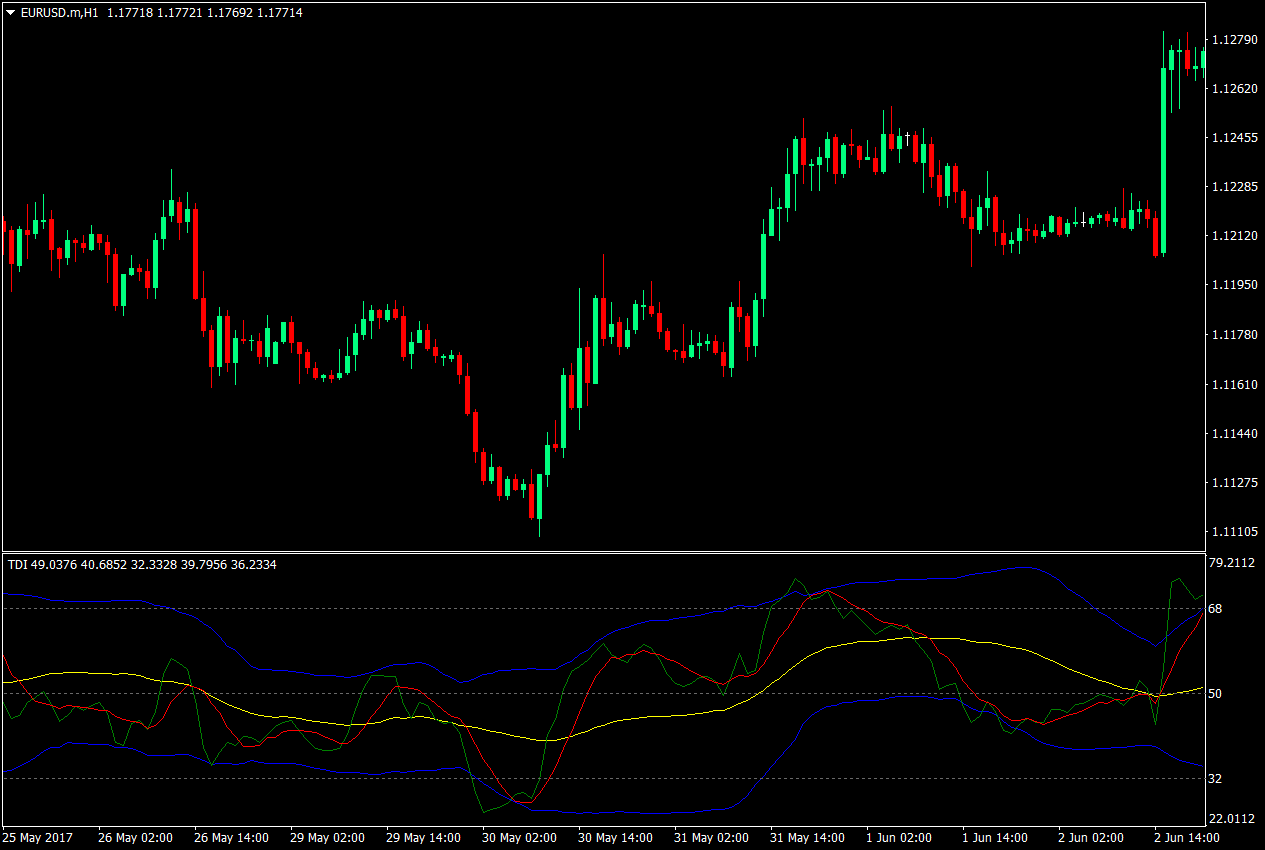
The Bollinger Bands, represented by the blue and yellow lines, allow traders to assess the volatility of the market and whether the market is overbought or oversold. The RSI, represented by the green line, somehow allows the trader to identify the movement of price as it is also somehow reflective to price action. The moving average, represented by the red line, allows traders to assess the general direction of the trend based on its direction and where RSI is relative to it.
Usually, TDI traders use this indicator by waiting for everything to be lined up. The Bollinger Bands indicating price is overbought or oversold, the RSI being at the overbought or oversold levels, RSI piercing through the moving average line, etc. Now, this is well and good. It would be great to have everything lined up for us. However, these rules sometimes tend to be too tight, restricting possible good trades from being taken. If you would notice on this chart, there would have been a lot of opportunities that could have been taken but wouldn’t pass the strict rules of the original TDI strategy.
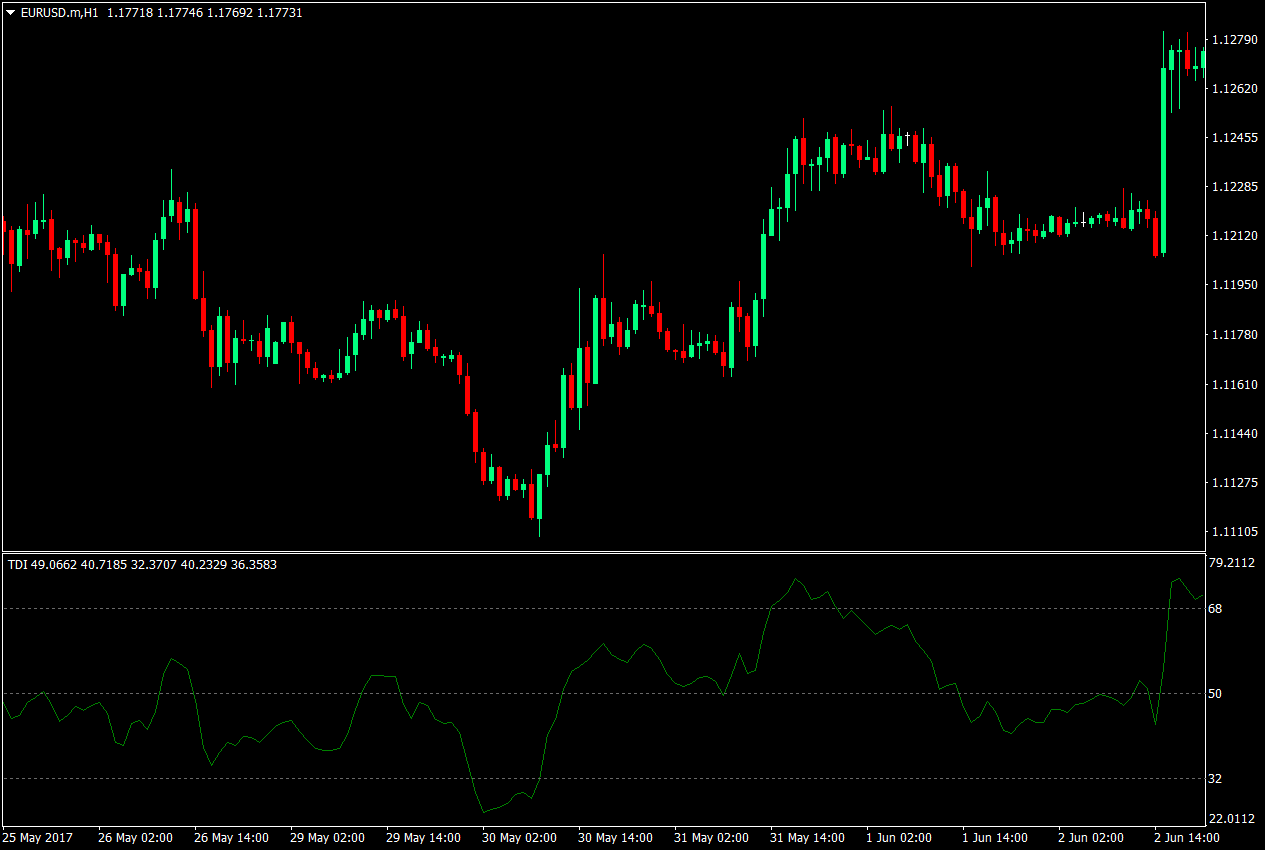
With this strategy, we will be banking on the idea that RSI somehow resembles or mimics the movement of price action. You could observe this on the chart below.
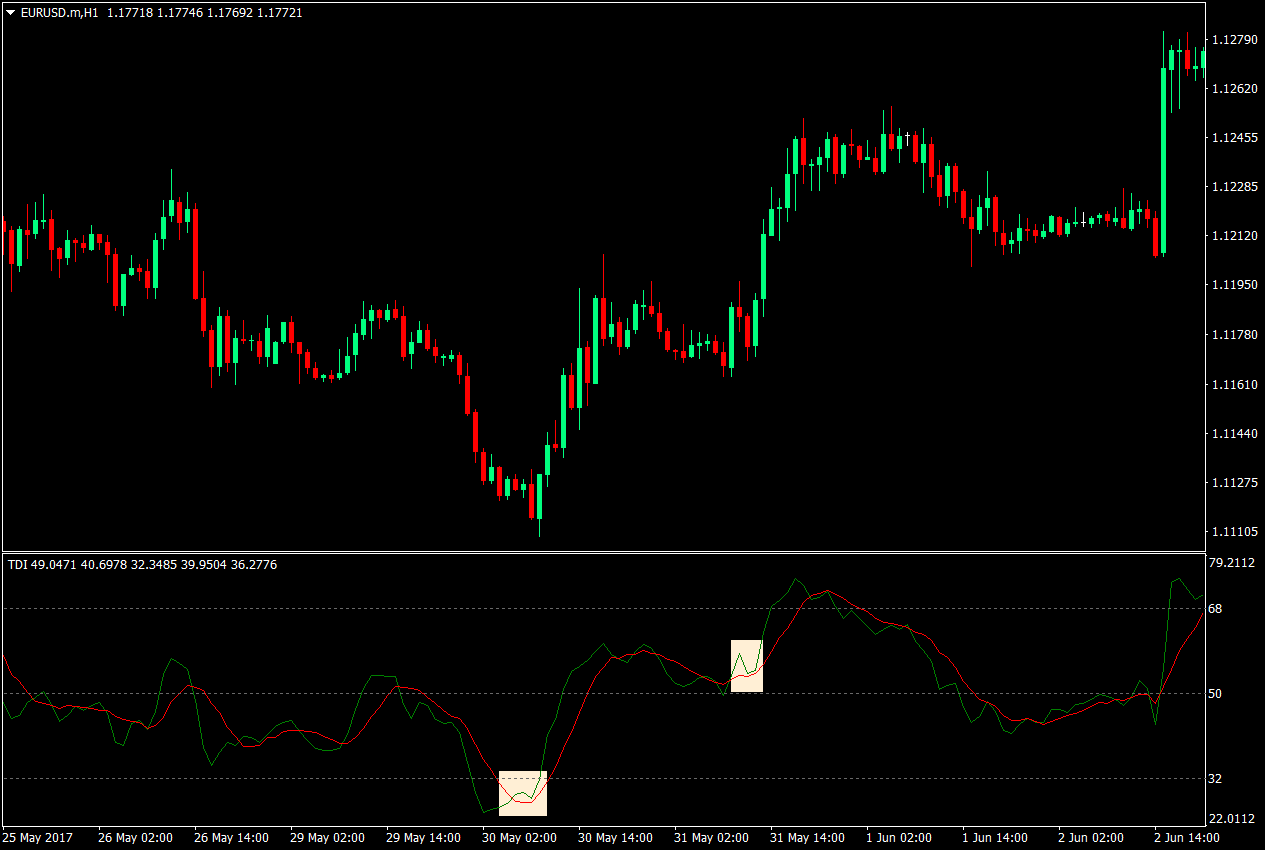
The next idea we will be banking on is the idea that price action does tend to bounce off moving averages. Although we are not using a regular moving average indicator, what we will be using is the moving average component of the TDI indicator. Unlike the regular TDI strategy wherein the trade signal is the green and red line crossover, what we will be looking for instead are instances wherein the green RSI line is bouncing off the red line.
The advantage to this strategy is that the change of direction is already confirmed by the previous crossover. Somehow, we are entering on an already confirmed change in direction, but due to the responsiveness of the RSI, we will not be entering too late.
The Buy Setup: Entry, Stop Loss, Exit
Buy Rules: To enter a buy trade, the green RSI line should be above the red line. After a short curling over of the RSI going down, the RSI should bounce back up off the red line, without crossing over it.
Stop Loss: The stop loss should be placed a few pips below the most recent minor swing low.
Exit: The trade should be closed as soon as the RSI curls back down on the close of the candle.
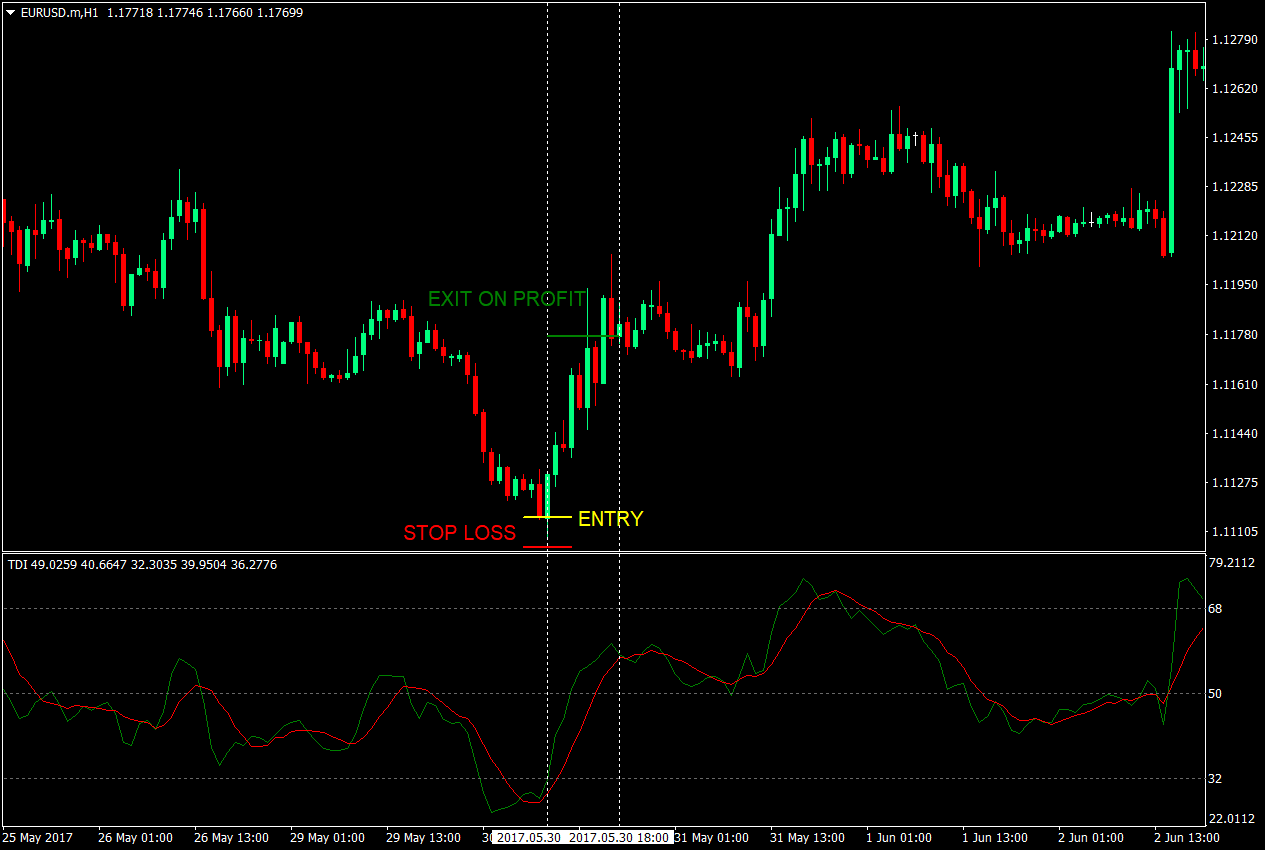
With this trade setup, the green line previously crossed the red line indicating that it might start heading up. However, it didn’t go straight up directly. The RSI first started to curl back down. As soon as the green RSI line curled back up, the buy entry could have been taken. The stop loss is just at the bottom of the entry candle risking only 10 pips. But price rallied up, and based on the rules, the trade was exited at 61 pips in profit. This gives the trade a 1:6 risk reward ratio.
The Sell Setup: Entry, Stop Loss, Exit
Sell Rules: To enter a sell trade setup, the green RSI line should be below the red line. If the green line curls back up, wait for it to start curling back down without crossing above the red line. As soon as the green line is pointing downwards on the close of the candle, enter a sell trade.
Stop Loss: The stop loss should be placed a few pips above the most recent minor swing high.
Exit: The trade should be closed as soon as the RSI curls back up on the close of the candle.
On this trade setup, the green RSI line had already been hovering below the red line for several candles but had curled back up. As soon as the green RSI line started pointed downwards, the trade should have been entered. The stop loss was just above the previous candle’s high, risking only 15 pips. The trade should have been closed as soon as the RSI line pointed back up, earning a profit of 45 pips. This would have yielded a 1:3 risk reward ratio.
Conclusion
This strategy is an ideal scalping strategy as it allows traders to take profit on slight price movements based on the TDI’s RSI line. It would also work best on a trending market since the slight curls of the RSI line represents minor retracements before it continues the trend. However, this strategy wouldn’t be as profitable during a ranging market, since on those markets, price tends to whipsaw up and down.
Recommended MT4 Broker
- Free $50 To Start Trading Instantly! (Withdrawable Profit)
- Deposit Bonus up to $5,000
- Unlimited Loyalty Program
- Award Winning Forex Broker
- Additional Exclusive Bonuses Throughout The Year

>> Claim Your $50 Bonus Here <<
Click here below to download: