


One of the types of strategies which many profitable traders use is a market flow type of trading strategy. These types of strategies utilize price action to identify the possible areas where price may reverse. In particular, market flow traders would often use the swing highs and swing lows of price action to identify support and resistance zones. It is in these areas where they would observe for possible market reversals. Although this trading strategy could be very effective, it is often very difficult to objectively identify possible market reversals especially for new traders. This strategy provides an objective method which traders can use to identify and confirm momentum reversals forming on an identified support or resistance zone.
Price Action Swing Low and Swing High Support and Resistance
Identifying support and resistance levels is one of the most fundamental skills traders should learn. This is because it allows traders to identify price areas where the market may reverse and allow them to enter trades at the most optimal price points.
Support areas are price zones where in price may reverse from a downward momentum towards an upward momentum. On the other hand, Resistance areas are price zones where the market may reverse from an upward momentum towards a downward momentum.
There are many ways to identify support and resistance areas. Some would connect multiple swing highs and swing lows to form a line which are then considered as support and resistance lines. Others would use dynamic areas of support and resistance using indicators.
One of the most effective ways to objectively identify support and resistance areas is by identifying swing highs and swing lows then using the area near the swing high or swing low as a support or resistance area. This is often marked by a horizontal line to identify a support or resistance level or a rectangle to indicate a support or resistance zone.
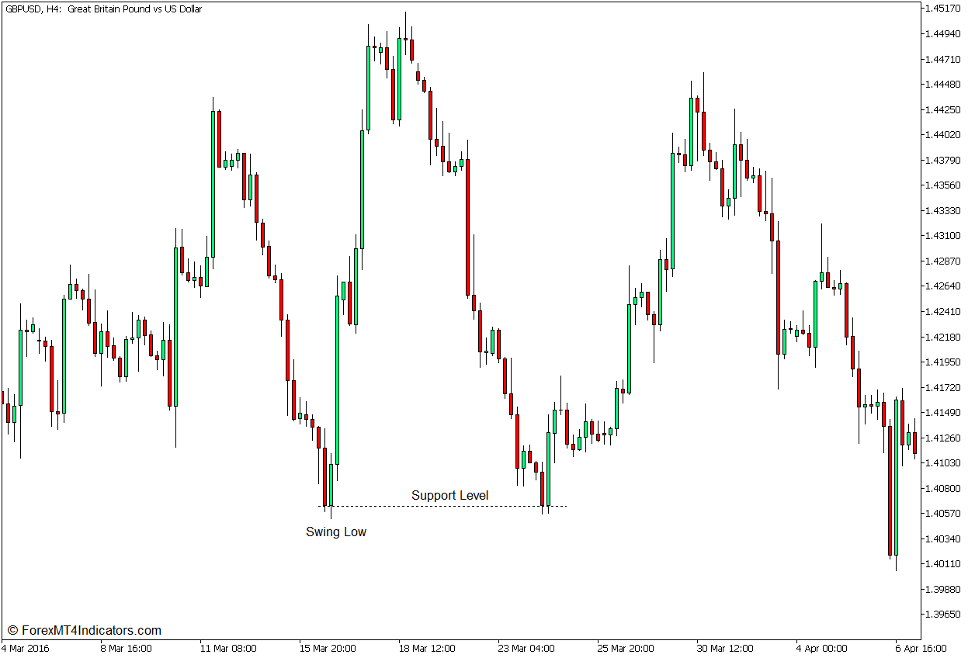
Traders can identify horizontal support areas by identifying swing lows. Then, using the wicks of the swing low, traders can then plot the support line.
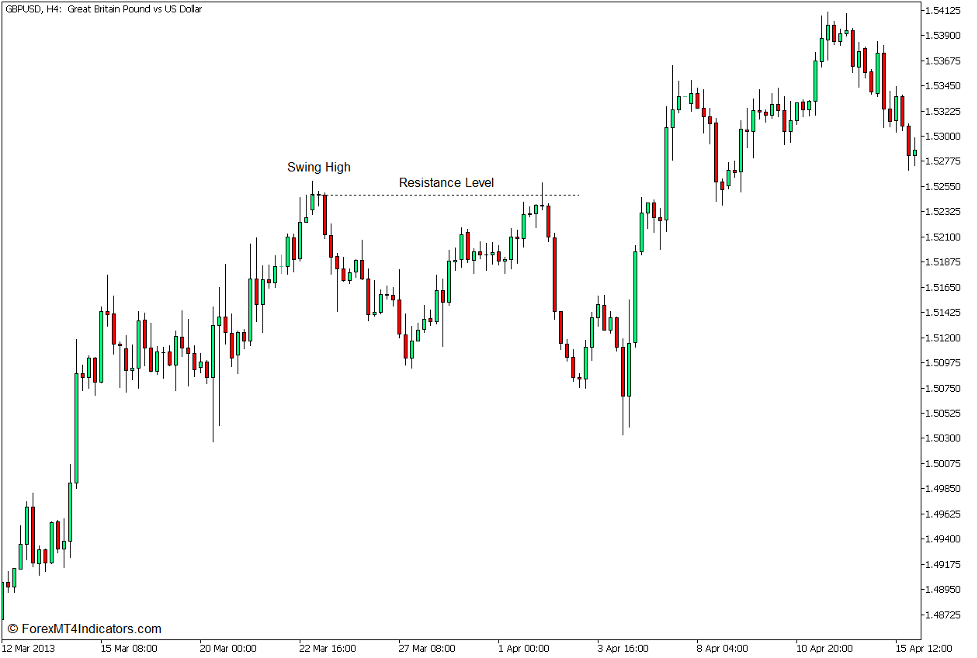
Horizontal support areas can also be identified by identifying swing highs. Then, using the upper wicks of the swing high, traders can then plot the horizontal line to indicate the resistance level.
Swing Line Indicator
The Swing Line Indicator is a momentum indicator which is based on the average movements of price. This information is extrapolated from the recent historical price points of the highs and lows of each price bar.
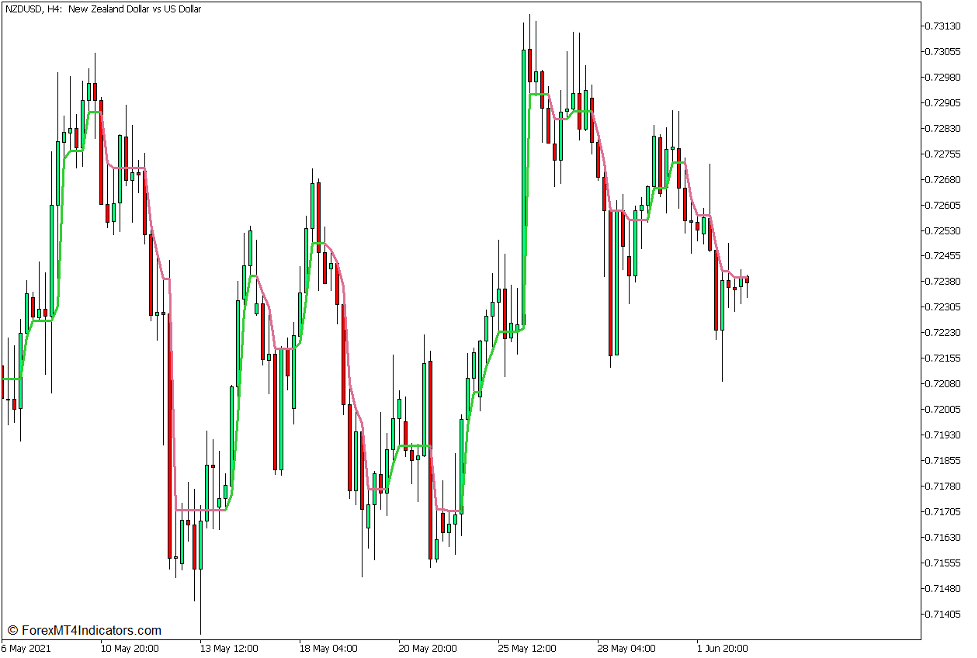
This indicator plots a line which follows price action quite closely, consistently intersecting with each price bar as it follows price movements along the price chart.
One unique feature of the Swing Line Indicator is that the line that it plots changes color to indicate the direction of the short term trend. It plots a lime green line whenever it detects a bullish momentum. On the other hand, it plots a pale violet red line whenever it detects a bearish momentum. Traders can simply use the changing of the color of the line to identify possible momentum reversals.
Trading Strategy Concept
Horizontal support and resistance areas are excellent price zones to observe for possible trend reversals. However, it does not always follow that price should reverse whenever it reaches a horizontal support or resistance area. The market should first show signs of a possible momentum reversal before traders could act on a reversal signal.
Being a trend following indicator which operates on the short-term momentum, the Swing Line Indicator is an excellent tool that traders can use to identify and confirm possible momentum reversals. It is very responsive to price action, which allows traders to objectively respond to market reversal signals.
Users should first identify the support or resistance area based on the swing high or swing low. Then, as price reaches the identified area, traders could then use the Swing Line Indicator to confirm the trend reversal and ride with the trend until the momentum fizzles out.
Buy Trade Setup
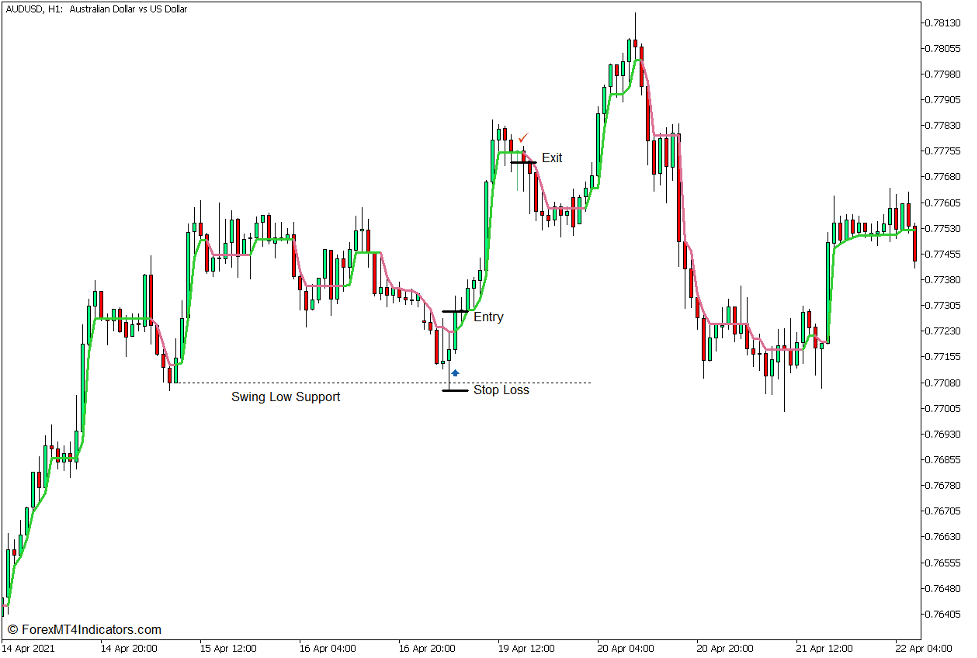
Entry
- Identify a valid swing low based on price action.
- Plot a horizontal line based on the area of the lower wick of the candle identified as the trough of the swing low. This would be the Support Line.
- Wait for price to revisit the area of the Support Line.
- Open a buy order as soon as the Swing Line Indicator changes to lime green.
Stop Loss
- Set the stop loss below the low of price action touching the Support Line.
Exit
- Close the trade as soon as the Swing Line reverts back to pale violet red.
Sell Trade Setup
Entry
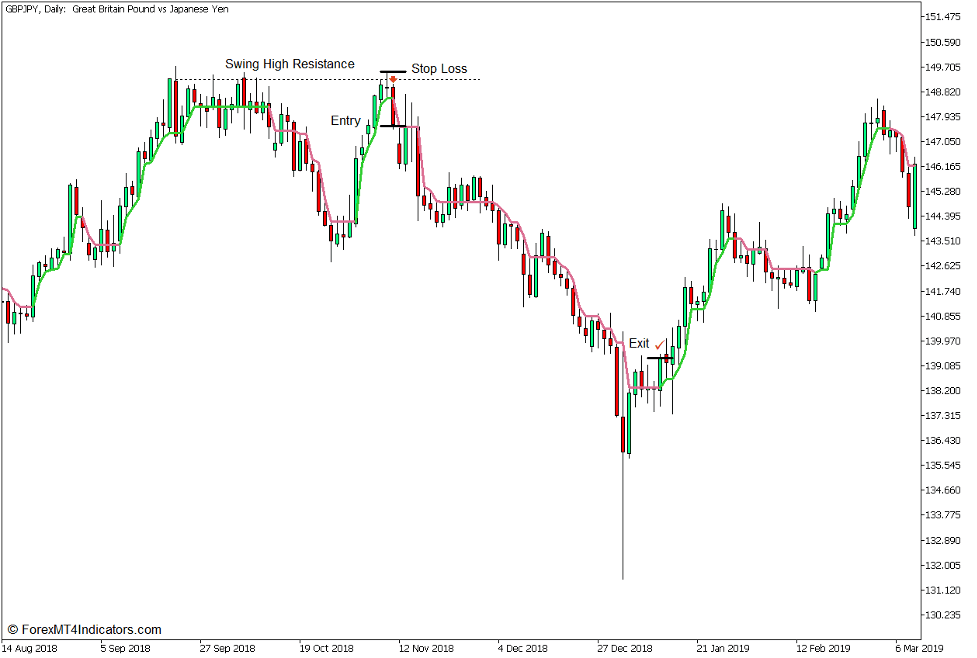
- Identify a valid swing high based on price action.
- Plot a horizontal line based on the area of the upper wick of the candle identified as the apex of the swing high. This would be the Resistance Line.
- Wait for price to revisit the area of the Resistance Line.
- Open a sell order as soon as the Swing Line Indicator changes to pale violet red.
Stop Loss
- Set the stop loss above the high of price action touching the Resistance Line.
Exit
- Close the trade as soon as the Swing Line reverts back to lime green.
Conclusion
This trading strategy can be a very effective trading strategy. This is because it utilizes two components which are critical for identifying a high probability trade entry – an area of possible support or resistance and an entry signal based on an objective momentum reversal.
Although this strategy can be an effective trade signal, it should still not be used as a standalone trade setup. It would be best for traders to use these signals in conjunction with an established market flow type of trading strategy for better results.
When using this strategy, traders should also learn how to correctly observe price action and read the flow of the market. This would allow them to identify the correct support and resistance zones, which significantly increases the probability of a profitable trade. Traders who can learn these fundamentals may then be profitable while incorporating these signals with a market flow type of strategy.
Recommended MT5 Brokers
XM Broker
- Free $50 To Start Trading Instantly! (Withdraw-able Profit)
- Deposit Bonus up to $5,000
- Unlimited Loyalty Program
- Award Winning Forex Broker
- Additional Exclusive Bonuses Throughout The Year

>> Sign Up for XM Broker Account here <<
FBS Broker
- Trade 100 Bonus: Free $100 to kickstart your trading journey!
- 100% Deposit Bonus: Double your deposit up to $10,000 and trade with enhanced capital.
- Leverage up to 1:3000: Maximizing potential profits with one of the highest leverage options available.
- ‘Best Customer Service Broker Asia’ Award: Recognized excellence in customer support and service.
- Seasonal Promotions: Enjoy a variety of exclusive bonuses and promotional offers all year round.

>> Sign Up for FBS Broker Account here <<
Click here below to download: