


The ever-shifting landscape of financial markets can be daunting for new traders. Between complex charts, technical indicators, and economic news, deciphering potential price movements feels like cracking a secret code. But fear not, intrepid investor! Today, we’ll delve into a powerful tool that can shed light on upcoming reversals: the RSI Divergence MT5 Indicator. Buckle up, and get ready to unlock valuable insights that can elevate your trading game.
Define the Rsi Divergence
Imagine you’re at a bustling street market, haggling over a beautiful scarf. The crowd’s frenzy suggests a high demand, pushing the price up. But suddenly, the fervor fades, and people lose interest. This divergence between initial enthusiasm and the dwindling crowd hints at a potential price drop for the scarf. Similarly, in the world of finance, RSI Divergence flags a possible shift in price direction by highlighting a discrepancy between price movements and the Relative Strength Index (RSI).
The RSI, a momentum oscillator, gauges whether an asset is overbought (priced too high) or oversold (priced too low). When the price keeps climbing but the RSI dips, it suggests a potential bullish divergence, indicating a possible price reversal upwards. Conversely, a falling price accompanied by a rising RSI hints at a bearish divergence, foreshadowing a potential downward trend.
Identifying Rsi Divergence in MT5
The MT5 platform, a popular choice for many traders, offers a built-in RSI indicator. But for a more robust analysis, consider downloading a dedicated RSI Divergence Indicator. These indicators visually highlight divergences on your charts, making them easier to spot.
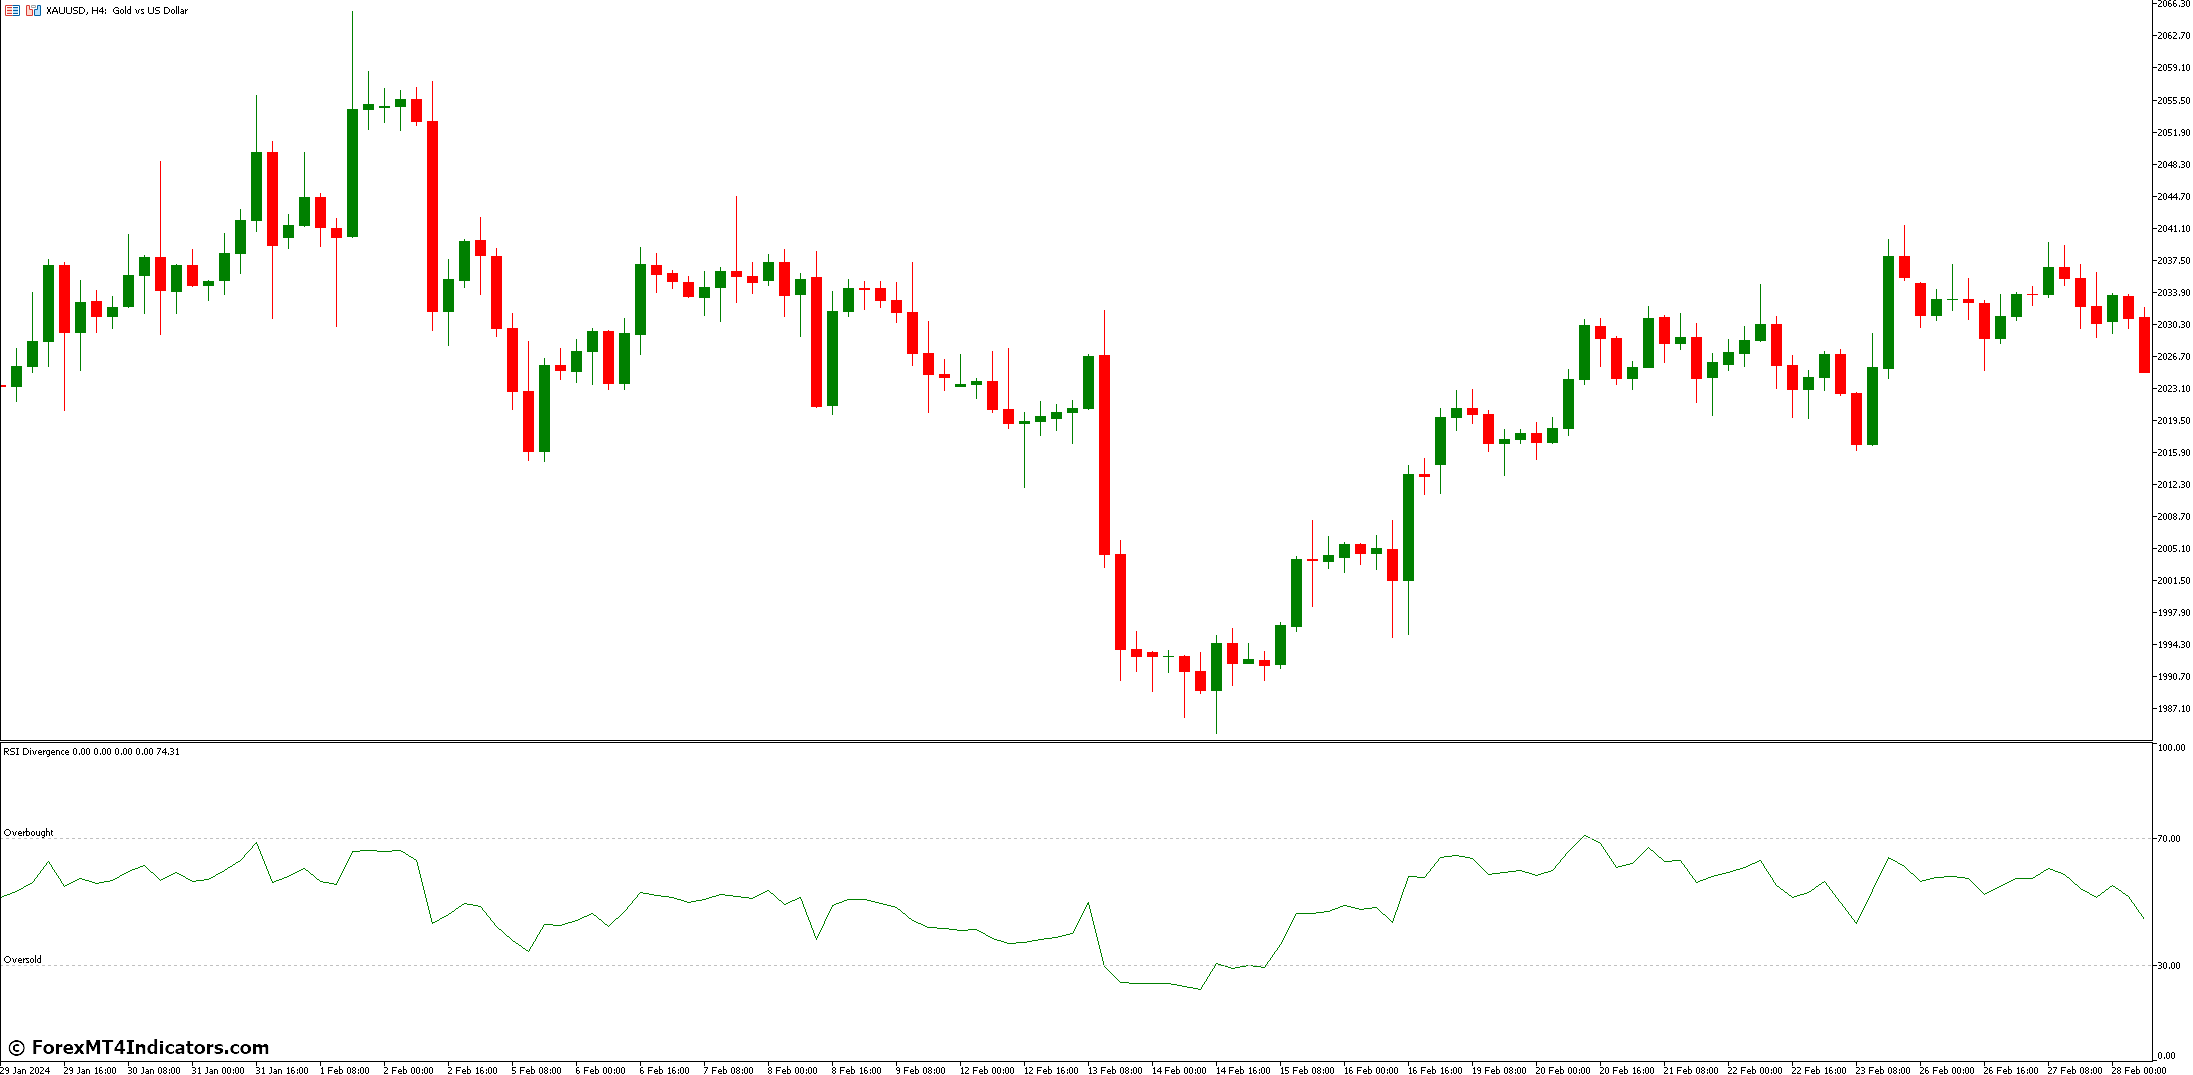
Here’s a breakdown of how to interpret the RSI and identify divergences:
- The RSI Line: This line oscillates between 0 and 100. Values above 70 generally indicate overbought territory, while values below 30 suggest an oversold market.
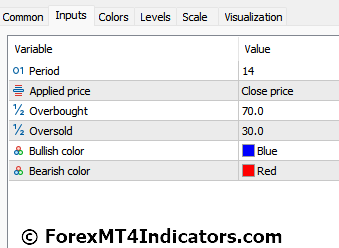
- Overbought/Oversold Levels: Many indicators allow you to customize these levels. Experiment to find settings that suit your trading style.
- Visually Spotting Divergence: Look for price swings that contradict the RSI’s direction. For instance, if the price keeps making new highs (upward trend), but the RSI forms lower highs (diverging downward), that’s a potential bullish divergence.
Significance Of RSI Divergence for Traders
So, why should you care about RSI Divergence? Here’s the lowdown:
- Potential Reversal Signal: Divergence can hint at an impending trend reversal, allowing you to potentially position yourself for profitable trades before the market shifts direction.
- Improved Trading Discipline: By incorporating confirmation strategies with divergence signals, you can avoid impulsive trades and inject more discipline into your trading approach.
- Combined Power: RSI Divergence shines even brighter when used alongside other technical indicators like support/resistance levels or moving averages.
Advanced RSI Divergence Concepts
As you gain experience, delve deeper into advanced RSI Divergence concepts:
Rsi Divergence Strength Meter
Some indicators incorporate a Divergence Strength Meter. This meter gauges the magnitude of the divergence, potentially helping you prioritize stronger signals with a higher probability of success.
Recognizing Failed Divergence and False Signals
Not all divergences lead to reversals. Sometimes, the price might continue trending in the initial direction, leading to failed divergence. Combining RSI Divergence with other indicators and price action analysis helps reduce the occurrence of false signals.
Market Volatility and Divergence
Highly volatile markets can generate more frequent divergences, which can be challenging to interpret. Consider incorporating volatility filters into your strategy or focusing on less volatile assets when starting.
Price Action With RSI Divergence
Combining RSI Divergence with established price action techniques like pin bars or engulfing candlesticks can strengthen your trade confirmations and improve overall trading accuracy.
Advantages and Disadvantages of Using RSI Divergence
Like any technical indicator, RSI Divergence has its pros and cons:
Advantages
- Early Reversal Signals: Divergence can provide early indications of potential trend reversals, allowing you to capitalize on opportunities before the price movement becomes widely apparent.
- Trading Discipline: By requiring confirmation before acting on divergence signals, you can develop a more disciplined and measured trading approach.
Disadvantages
- Stand-Alone Indicator: RSI Divergence alone shouldn’t be the sole basis for your trading decisions. Always use it in conjunction with other technical indicators and price action analysis.
- False Signals: Divergence doesn’t guarantee a reversal. There can be instances of failed divergence, leading to missed opportunities or even losing trades.
How to Trade with RSI Divergence Indicator
Buy Entry
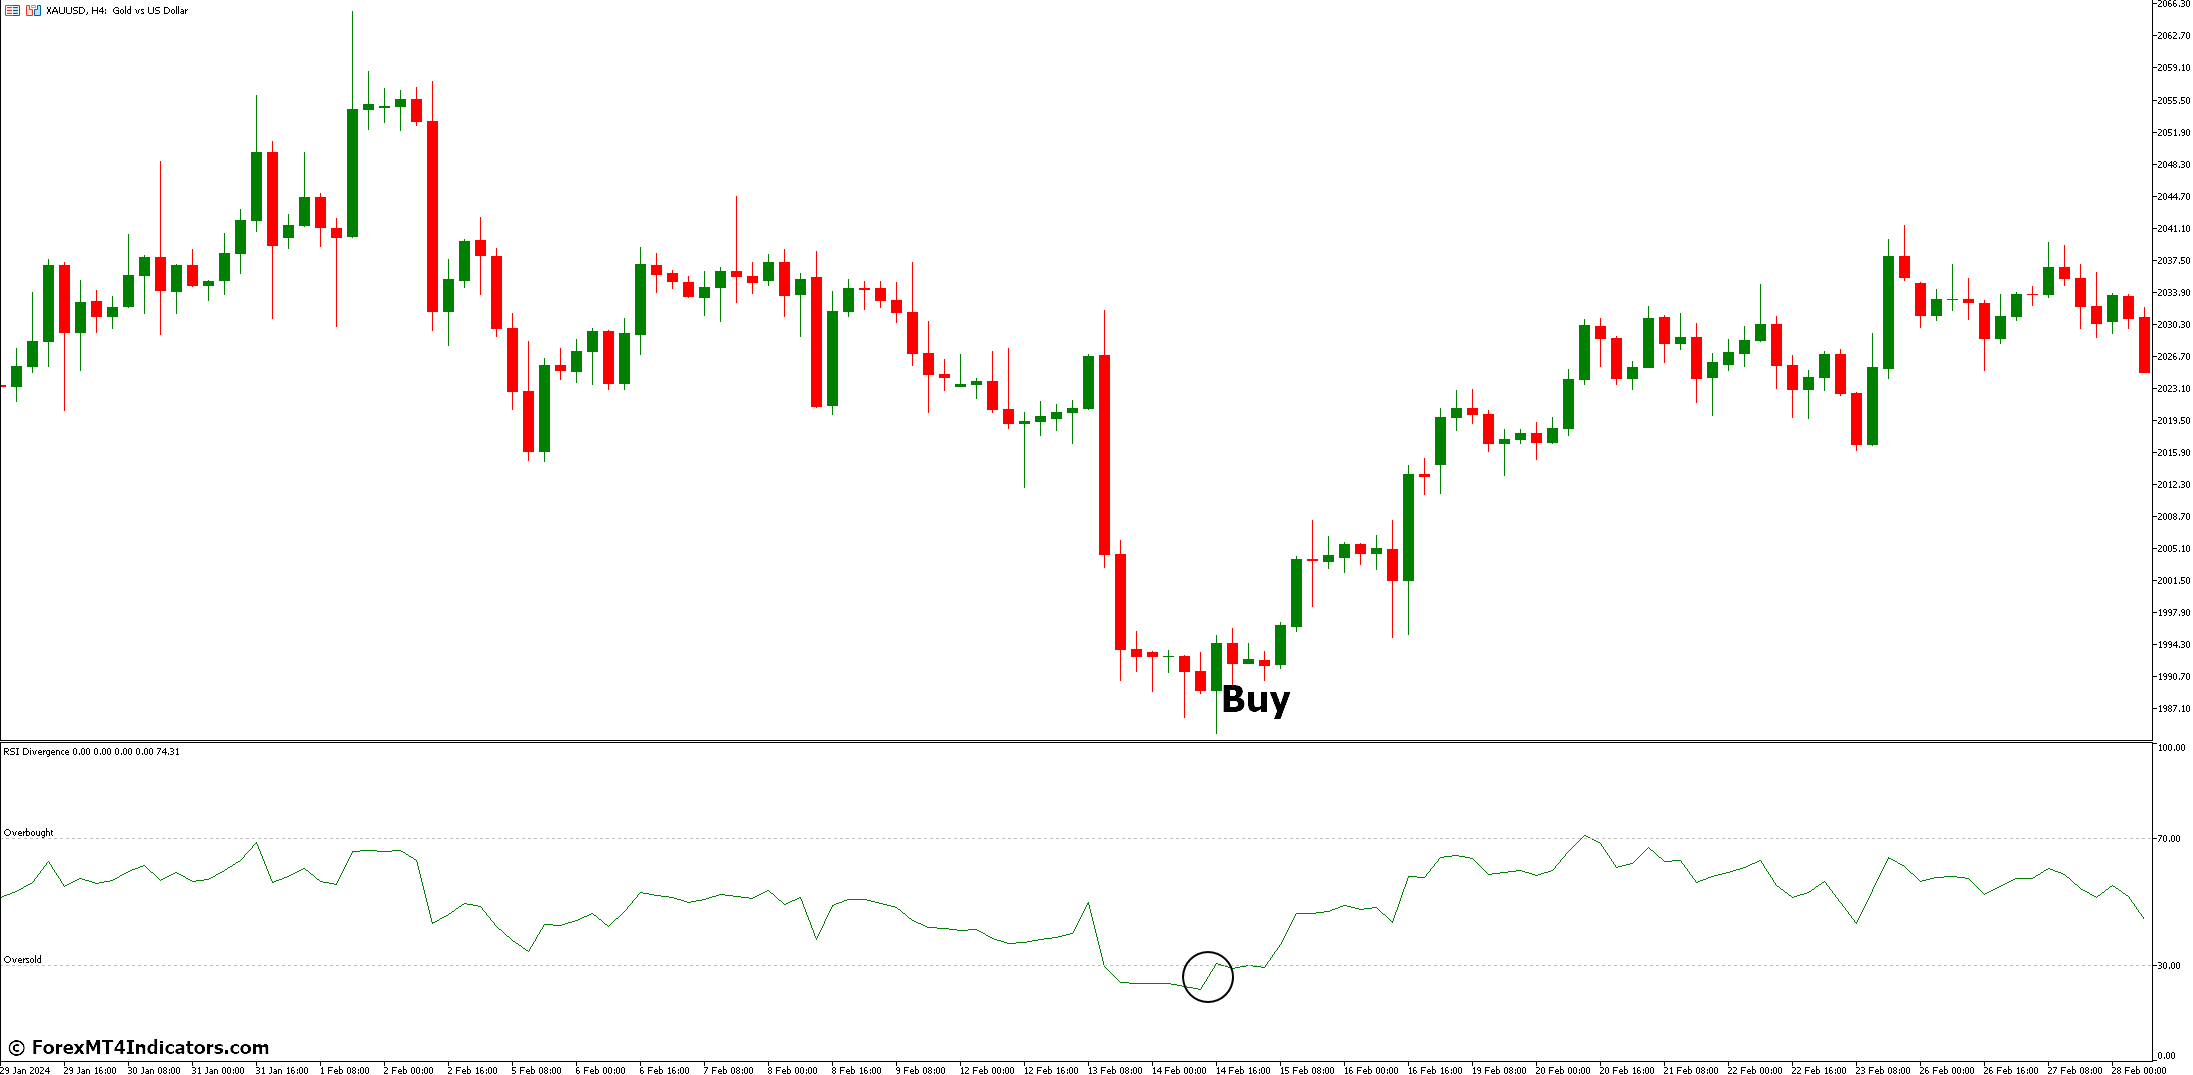
- Look for a bullish divergence on your chart. This occurs when the price makes lower lows while the RSI forms higher lows.
- Combine the divergence with a supportive technical indicator like a hammer candlestick pattern or the price bouncing off a support level.
- Place a stop-loss order below the recent swing low (the lowest point before the potential reversal).
- Set a take-profit target based on your risk-reward ratio and overall trading strategy. Consider factors like historical price movements and potential resistance levels.
Sell Entry
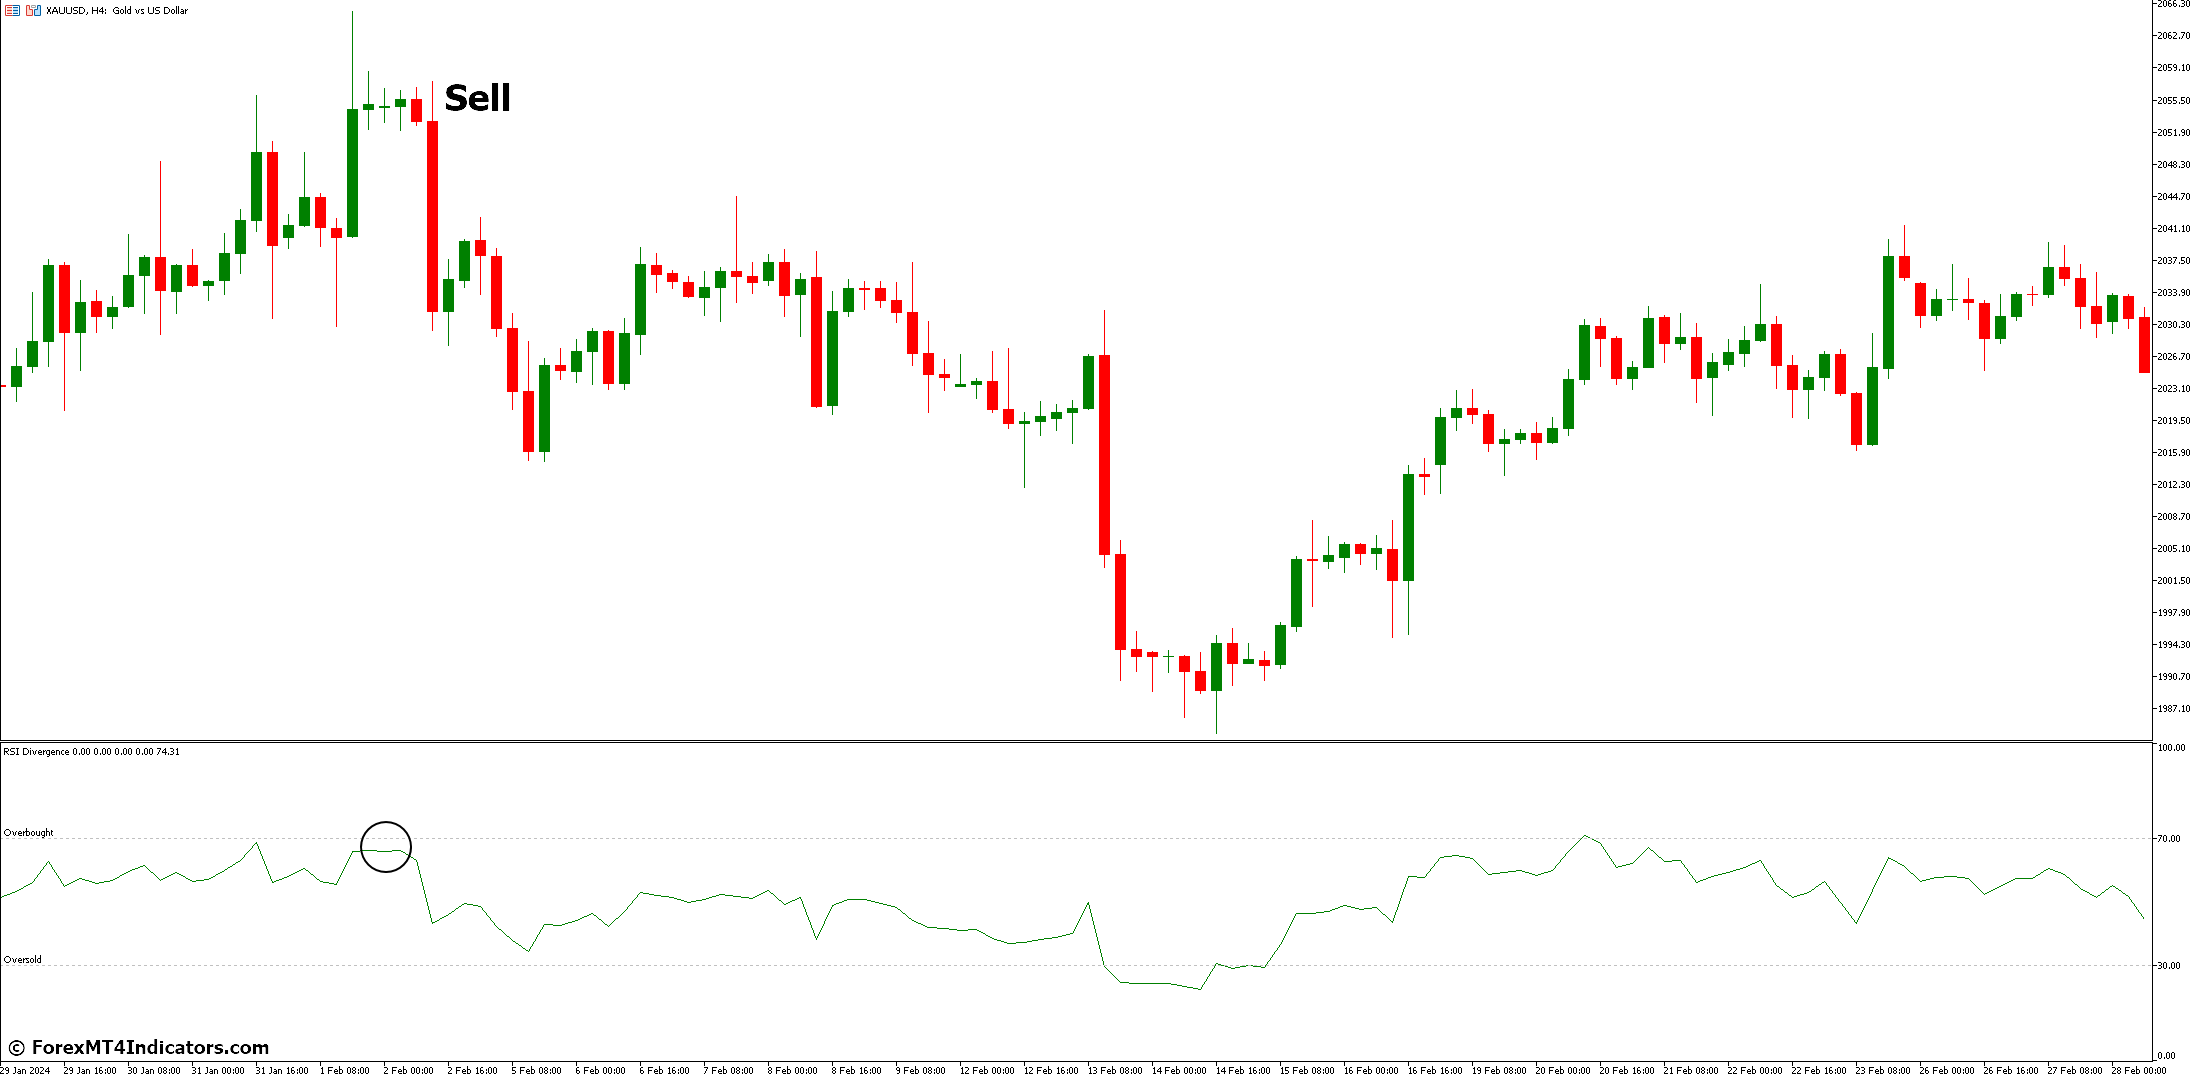
- Identify a bearish divergence on your chart. This happens when the price makes higher highs, but the RSI forms lower highs.
- Look for confirmation from a bearish technical indicator like a shooting star candlestick pattern or the price breaking below a resistance level.
- Place a stop-loss order above the recent swing high (the highest point before the potential reversal).
- Set a take-profit target aligned with your risk-reward ratio and trading strategy. Consider factors like historical price movements and potential support levels.
RSI Divergence Indicator Settings
Conclusion
RSI Divergence highlights potential trend reversals by identifying discrepancies between price movements and the RSI indicator. Utilize confirmation strategies and combine it with other technical indicators for a well-rounded trading approach. Integrate RSI Divergence seamlessly into your overall trading strategy. Consider your risk tolerance, preferred asset classes, and timeframe when developing your trading plan.
Recommended MT5 Brokers
XM Broker
- Free $50 To Start Trading Instantly! (Withdraw-able Profit)
- Deposit Bonus up to $5,000
- Unlimited Loyalty Program
- Award Winning Forex Broker
- Additional Exclusive Bonuses Throughout The Year

>> Sign Up for XM Broker Account here <<
FBS Broker
- Trade 100 Bonus: Free $100 to kickstart your trading journey!
- 100% Deposit Bonus: Double your deposit up to $10,000 and trade with enhanced capital.
- Leverage up to 1:3000: Maximizing potential profits with one of the highest leverage options available.
- ‘Best Customer Service Broker Asia’ Award: Recognized excellence in customer support and service.
- Seasonal Promotions: Enjoy a variety of exclusive bonuses and promotional offers all year round.

>> Sign Up for FBS Broker Account here <<

(Free MT5 Indicators Download)
Click here below to download: