


Some people love to take risks. They are fine with taking huge risks if the reward is high enough. These type of people, if they opt to become traders, often wind up to be the type of traders who love taking risky trades with a possibility of gaining high rewards. However, not all traders are like that. There are those who would want to mitigate risks as much as possible. There are traders would rather take high probability trades even if it meant that they would taking lower yields compared to the others. And that is fine. There is no right or wrong way to trade, only profitable or non-profitable traders.
The Metro Trend Forex Trading Strategy is more for the second type of trader. This strategy is for those who are fine with relatively lower yield yet have better consistency. This is for those who would prefer high probability trades rather than high yielding trades. Although this strategy is much of a high probability trade strategy, it still delivers positive reward-risk ratios, which makes it even better for such traders. It allows for consistent profitability through a high win-ratio and a decent reward-risk ratio.
MACD Trend Candles
The Moving Average Convergence and Divergence (MACD) indicator is one of the staple momentum indicators for most traders. It is a proven technical analysis tool which provides high quality trade signals. Retail traders use it, professional traders use it, technical analysts and chartists use it, even institutional (bank) traders use it.
The MACD is traditionally displayed as an oscillating indicator. It is plotted as an unbounded oscillating indicator which oscillates around a midline. Its oscillations mirror price action movement quite well, moving higher whenever it detects a bullish trend or lower if otherwise.
The MACD oscillates around its midline, which is at zero. Whenever its lines or histogram bars stray far from the midline, traders could assume that the market is either overbought or oversold. Crosses over the midline also indicate a change in trend direction.
The MACD Trend Candles however removes the standard oscillating lines and bars from the window. Instead, it conveniently overlays bars on the price chart. It indicates trend direction by changing colors depending on how the oscillating traditional MACD should be displayed. It uses four different colors to represent the position of the MACD lines and bars and its trajectory, whether the MACD is rising while below the midline, rising while above the midline, falling while above the midline, or falling while below the midline. All these conditions have different implications regarding trend reversals, overextended market conditions and trend direction.
METRO Indicator
The METRO indicator is a custom oscillating indicator which helps traders identify momentum and trend direction. It is a bounded oscillator with markers at the 20 to 80 range. Price is considered oversold when the METRO indicator line draws nearer to 20 and overbought if it is drawn nearer to 80.
What is unique about this indicator is that instead of having a midline which acts as a trigger line, it draws a separate line to act as the trigger line. This line is drawn freely on the indicator window and moves up and down depending on how it detects trend direction. This line typically represents the long-term trend. It also displays another two lines which represents the short-term trend. These lines tend to move much faster compare to the long-term line, and shadows price action movement closely.
Trading Strategy
This trading strategy is geared towards taking high quality trades that profit on short- to mid-term trends. These trends to move in one direction for several candles before the trend pauses. This strategy profits on those short moves and exits from the trade as soon as price retraces.
The entry signals on this strategy is based on the confluence of the METRO indicator and the MACD Trend Candles. The colors representing a crossover of the MACD’s midline are our main entry signals, while the METRO indicator lines’ stacking would be our trend direction filter.
Indicators:
- MACD Trend Candles v3
- METRO
- Period RSI: 19
Timeframes: preferably 4-hour and daily charts
Currency Pairs: major and minor pairs, and some commodities
Trading Session: Tokyo, London and New York
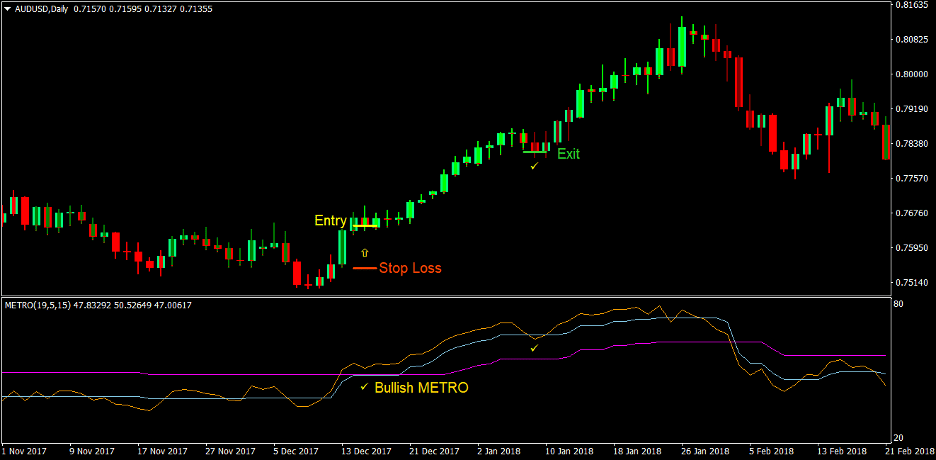
Buy Trade Setup
Entry
- The METRO indicator lines should be stacked in the following order:
- Orange: top
- Sky Blue: middle
- Magenta: bottom
- The METRO indicator’s orange line should have freshly crossed above the sky-blue line indicating a bullish trend reversal
- The MACD Trend Candles should change to lime indicating that the MACD lines and histograms have crossed above the midline representing a bullish trend reversal
- These bullish trend signals should be somewhat aligned
- Enter a buy order on the confluence of the conditions above
Stop Loss
- Set the stop loss at the support level below the entry candle
Exit
- Close the trade as soon as the METRO indicator’s orange line crosses below the sky-blue line
- Close the trade as soon as the MACD Trend Candles change to another color other than lime
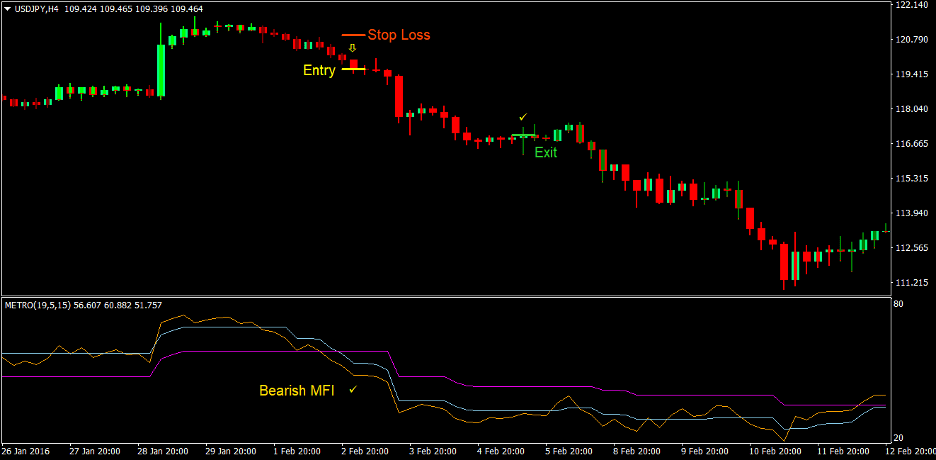
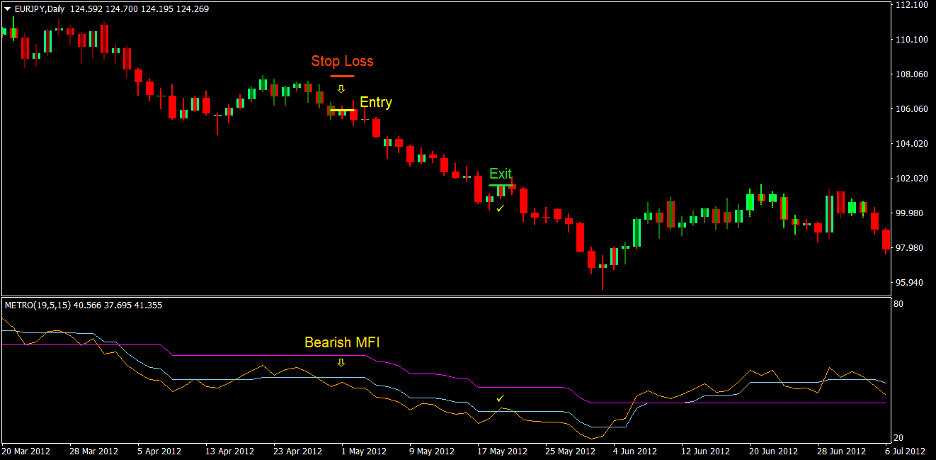
Sell Trade Setup
Entry
- The METRO indicator lines should be stacked in the following order:
- Orange: bottom
- Sky Blue: middle
- Magenta: top
- The METRO indicator’s orange line should have freshly crossed below the sky-blue line indicating a bearish trend reversal
- The MACD Trend Candles should change to red indicating that the MACD lines and histograms have crossed below the midline representing a bearish trend reversal
- These bearish trend signals should be somewhat aligned
- Enter a sell order on the confluence of the conditions above
Stop Loss
- Set the stop loss at the resistance level above the entry candle
Exit
- Close the trade as soon as the METRO indicator’s orange line crosses above the sky-blue line
- Close the trade as soon as the MACD Trend Candles change to another color other than red
Conclusion
As discussed earlier, this trade strategy leans more towards producing high probability trade setups rather than high yielding trades. This is because the strategy aims to trade on fresh short- to mid-term trends and opts to exit early at the slightest indication of a reversal. This gives the strategy a higher win-ratio compared to other trading strategies. However, it also means missing out on higher yields whenever the trend continues further. This is typical during strong trends. It is better to exit the trade in profit rather than being greedy and opting for higher returns but instead being left with an open trade as the market reverses.
Recommended MT4 Brokers
XM Broker
- Free $50 To Start Trading Instantly! (Withdraw-able Profit)
- Deposit Bonus up to $5,000
- Unlimited Loyalty Program
- Award Winning Forex Broker
- Additional Exclusive Bonuses Throughout The Year

>> Sign Up for XM Broker Account here <<
FBS Broker
- Trade 100 Bonus: Free $100 to kickstart your trading journey!
- 100% Deposit Bonus: Double your deposit up to $10,000 and trade with enhanced capital.
- Leverage up to 1:3000: Maximizing potential profits with one of the highest leverage options available.
- ‘Best Customer Service Broker Asia’ Award: Recognized excellence in customer support and service.
- Seasonal Promotions: Enjoy a variety of exclusive bonuses and promotional offers all year round.

>> Sign Up for FBS Broker Account here <<
Click here below to download: