


MACD Pivot Point Divergence Day Forex Trading Strategy
Trading indicators are simply tools that assist a trader in finding a trading setup. In most cases, indicators are seldom profitable as a standalone trading strategy. I hate to break it to you, but you would hard pressed to find an indicator that would be consistently profitable if you’d use it as your only basis for taking a trade. However, there are indicators that if you’d look at it, it just seems to work but not consistently. Combine it with other indicators though and it just seems to work like magic.
The Pivot Point
A Pivot Point is an indicator that prints significant levels based on the high, low and close of the previous period. From the Pivot Point (PP) itself, several supports and resistances are plotted above and below it. These are usually marked as S1, S2 and S3 for the supports, and R1, R2 and R3 for the resistances.
These significant levels are very powerful because many traders are looking at it. In many cases, price would bounce off it respecting it either as a support or a resistance.
Another characteristic of the Pivot Point is that it doesn’t get reprinted. The Pivot Point, supports and resistances plotted at the beginning of the day, week or month doesn’t change. This sets it apart from other indicators that gets reprinted, which causes confusion among traders and nullifies their trading setups.
The MACD Divergence
The MACD or Moving Average Convergence and Divergence is also a well known and widely used trading indicator. It is basically a crossover of two moving averages plotted on a separate window as an oscillator.
There are many ways to use the MACD, however one powerful way of using the MACD is by taking signals based on divergences.
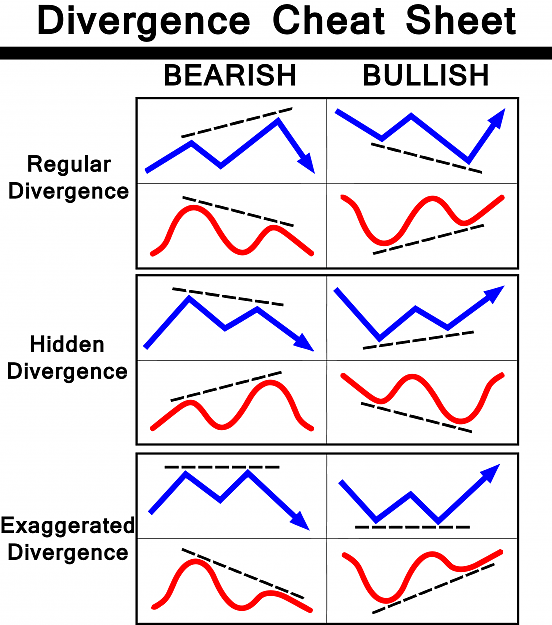
Divergences are discrepancies between the oscillation of price on the price chart and an oscillating indicator on its own window. As price moves, across the chart, it creates peaks and troughs as it forms highs and lows. Oscillating indicators also mirror the peaks and troughs that price makes, only that the peaks and troughs are noticeable in its own window. As these peaks and troughs are plotted, price would be making higher highs, lower highs, higher lows or lower lows. In a normal market condition, the oscillating indicator would also be printing the same. If price prints a higher high, the oscillating indicator also prints a higher high in its own window. If it prints a lower low, it also does the same in its own window. However, there are cases when price and the oscillating indicator would disagree. Price might print a higher high while the oscillating indicator might print a lower low. This condition is what we call a divergence, and divergences are very powerful as they often indicate a probable market reversal.
Below is a cheat sheet of divergences
Trading Strategy Concept
The pivot point has usually been a respected support and resistance level. This is probably because many traders are looking at it. The MACD divergence is also a very powerful trading strategy by itself. Combining these two together would be a very effective trading strategy for catching reversals.
In this strategy we will be looking for price to bounce off a pivot point, support or resistance. However, we will not be taking all touches and signals of a bounce by itself. We will be taking bounces that coincide with a MACD divergence.
Also, to easily determine a MACD divergence, we will be using a custom indicator that conveniently plots a MACD divergence as it finds it.
Indicators
- Pivot_AllLevels
- 1
Timeframe: 15-minute chart
Currency Pair: any
Trading Session: any
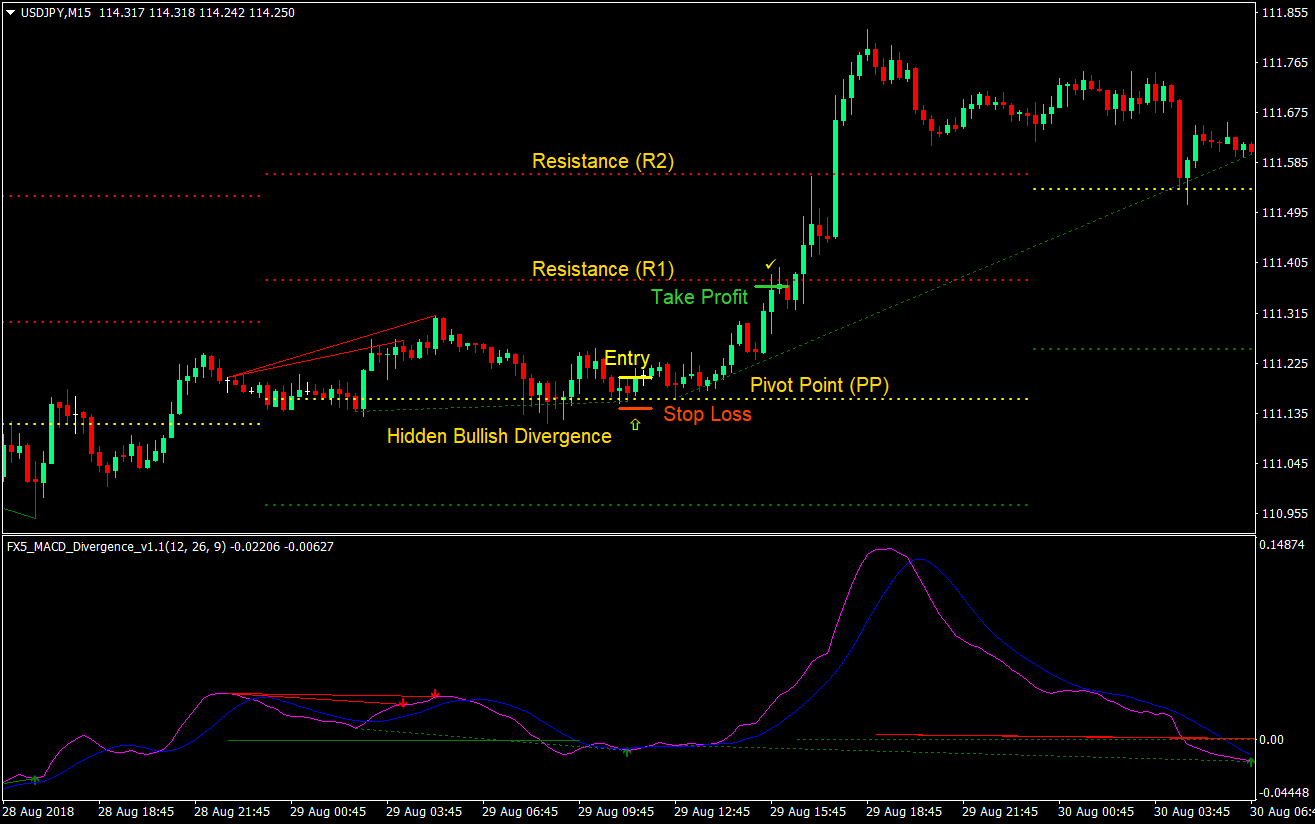
Buy (Long) Trade Setup
Entry
- Wait for price to come from above and touch either the Pivot Point (PP) (yellow) or a support level (S1 or S2) (green)
- Wait for a bullish divergence to be plotted by the MACD_Divergence indicator, indicated by either a solid line below price (regular bullish divergence) or a broken line below price (hidden bullish divergence)
- If the current candle is bullish take a buy trade on the close of the candle, if not wait if the next candle plotted would be bullish
Stop Loss
- Place the stop loss immediately below the entry candle or the pivot point or support level
- Close the trade if an opposing divergence is plotted by the indicator whether in profit or at a loss
Take Profit
- Set the take profit target a few pips below the next significant level above price: pivot point, support (S1) or resistance (R1)
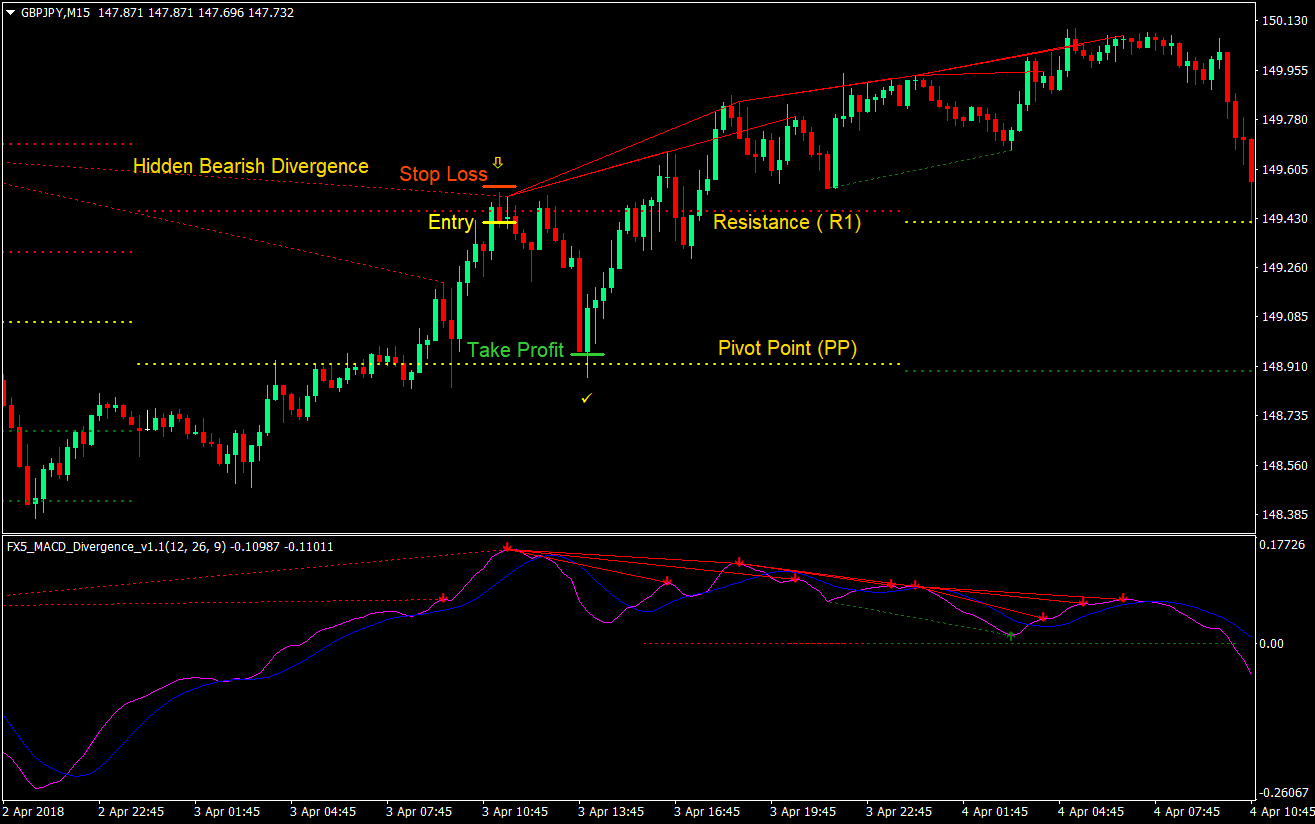
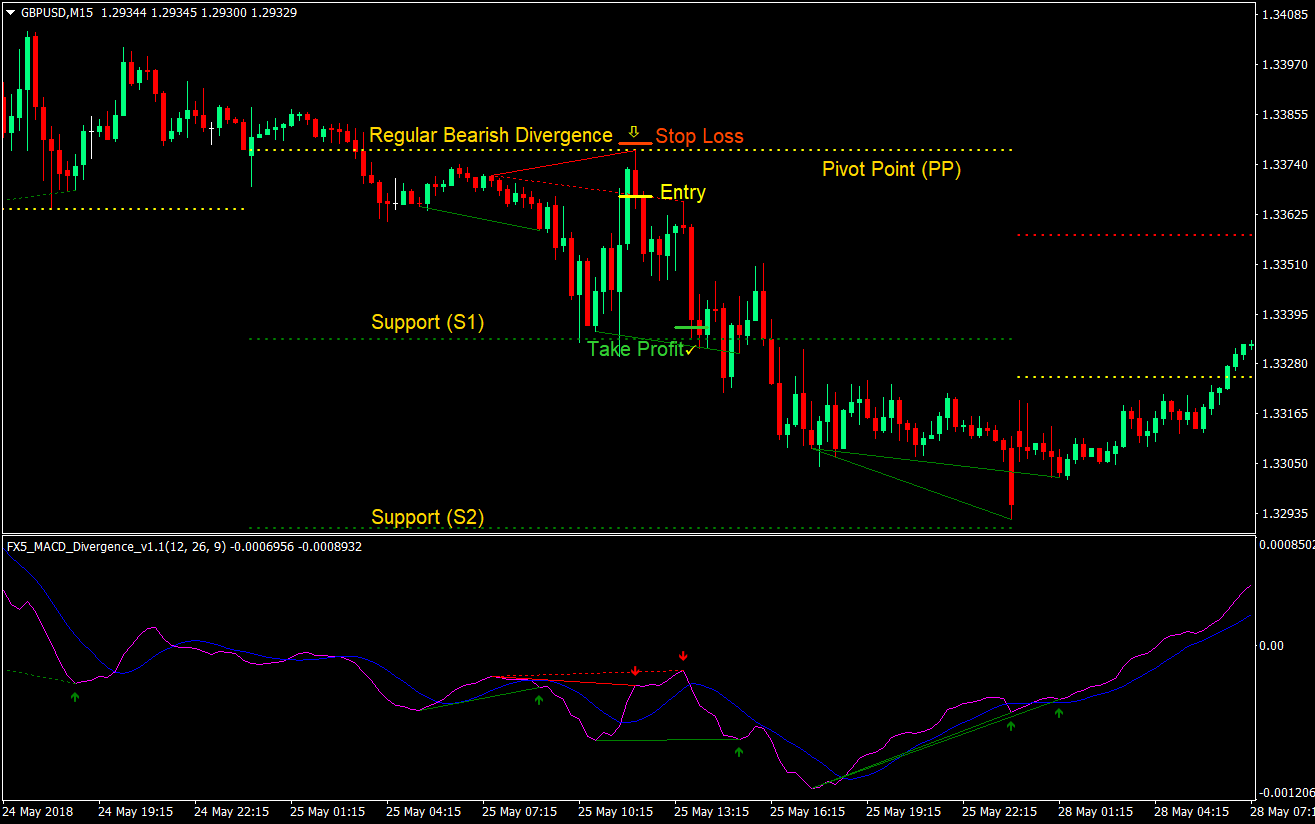
Sell (Short) Trade Setup
Entry
- Wait for price to come from below and touch either the Pivot Point (PP) (yellow) or a resistance level (R1 or R2) (red)
- Wait for a bearish divergence to be plotted by the MACD_Divergence indicator, indicated by either a solid line above price (regular bullish divergence) or a broken line above price (hidden bullish divergence)
- If the current candle is bearish take a buy trade on the close of the candle, if not wait if the next candle plotted would be bearish
Stop Loss
- Place the stop loss immediately above the entry candle or the pivot point or resistance level
Take Profit/Exit
- Set the take profit target a few pips below the next significant level below price: pivot point, support (S1) or resistance (R1)
- Close the trade if an opposing divergence is plotted by the indicator whether in profit or at a loss
Conclusion
This strategy is very effective and is also based on my own experience. The MACD divergence alone is already a high probability trade setup. Combining it with the pivot points makes it even more powerful. The key is only to wait for the right trade setups and allow probabilities to work in your favor.
Recommended MT4 Broker
- Free $50 To Start Trading Instantly! (Withdrawable Profit)
- Deposit Bonus up to $5,000
- Unlimited Loyalty Program
- Award Winning Forex Broker
- Additional Exclusive Bonuses Throughout The Year

>> Claim Your $50 Bonus Here <<
Click here below to download: