


Forex Candlestick Patterns Introduction
[toc]If you’re looking for a way to read the price action then this candlestick pattern post is for you. No doubt that with candlestick pattern, you’ll be able to:
-
Get Early Signal
-
Know when the price shows weakness – hint : Reverse
-
And More…
But in this post, the main purpose we’re going to learn the candlestick patterns is because to know what happen when the price is approach with candlestick pattern. After you have mastered the basic patterns, you can proceed to learn and study the forex candlestick strategies.
You’ll discover the most 3 powerful candlestick patterns in this post that will absolutely improve your trading analysis process. In the end of the day, this will lead to profits and huge return rate.
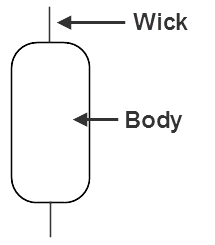
The basic of candlestick:
 Body
Body
 Body
BodyShows the range between the open and close within the period of single candlestick.
-
How strong the momentum of bull or bear
-
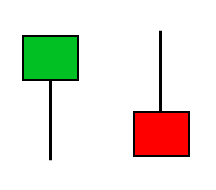
Usually, green color body indicates price moving up/bullish. Whilst, the red color body indicates price moving down/bearish.
Wick
The range between low and high within the period.
-
Shows how strong the rejection of the price – AKA reversal
The Forex Candlestick Patterns Method:
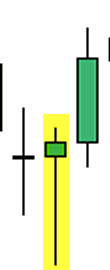
Pattern 1: Pin Bar
The name says it all about the shape. Here is the screenshot of pin bar.
There are two types of pin bar:
-
Bullish Pin Bar(yellow highlight)
-
Bearish Pin Bar
Bullish Pin Bar
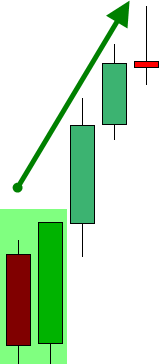
The bullish pin bar is for buy signal. It is recommended to trade the bullish pin bar pattern during retracement or downtrend.
Example 1
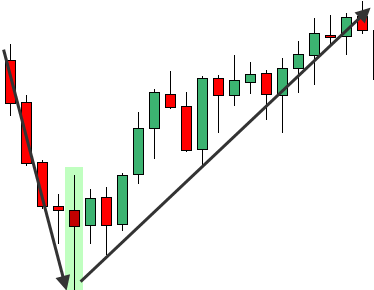
Example 2 (retracement)
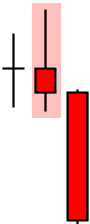
Bearish Pin Bar
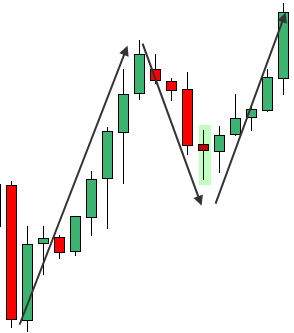
The bearish pin bar is for a sell signal. It is recommended to trade the bearish pin bar pattern during retracement or uptrend for effective result.
Example 1
Example 2
Pattern 2: Doji Star
The formation of doji star indicates a change of trend/reversal.
Two types of Doji Star:
-
Morning Doji Star: 3 day bullish reversal pattern that formed during downtrend. The first candle has a long bearish body, the second candle forms a doji. The last candle is bullish with long candle. Sometimes there is a gap between the first and second candle but this doesn’t necessary when identifying this pattern since in forex market, you can barely or rarely see a gap.
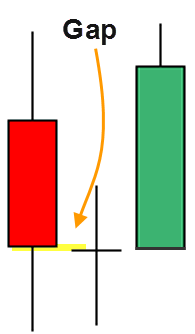
Look for extra bullish movement of the price after this pattern for entry.
-
Whilst, Evening Doji Star: 3 day bearish reversal pattern that formed during uptrend. The first candle has a long bullish body, the second candle forms a doji that open higher than previous 1st candle and the last candle is bearish with long candle.
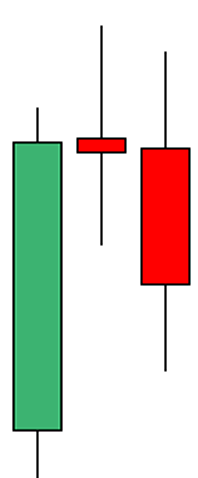
Look for extra bearish movement of the price after this pattern for entry.
Pattern 3: Engulfing pattern
The pattern can be applied for reversal and continuation. The engulfing pattern consists of 2 different colors of candlesticks.
There are two types of engulfing pattern:
-
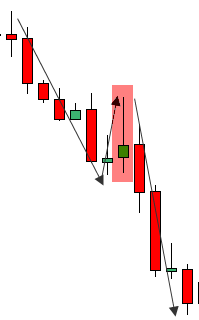
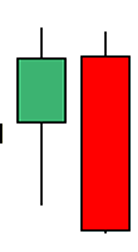
1 – Bullish Engulfing Pattern: The first candle is bearish. The Second candle must be bullish and engulf the previous candle’s body.
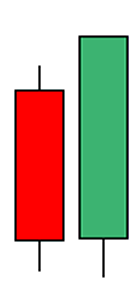
Example:
Look for extra bullish movement of the price after the pattern formation for entry.
-
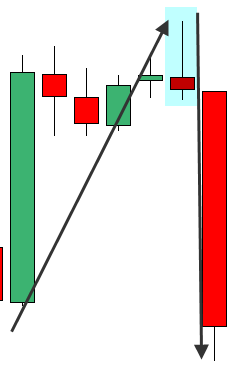
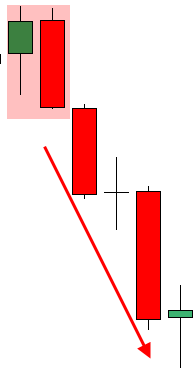
2 – Bearish Engulfing Pattern: The first candle is bullish. The Second candle must be bearish and engulf the previous candle’s body.
Example:
Look for extra bullish movement of the price after the pattern formation for entry.
The Forex Candlestick Patterns Method In A Nutshell:
So, here is a basic outline of the candlestick patterns:
-
Pin Bar Pattern
-
Doji Star
-
Engulfing Pattern
***Tip: Make sure to use other technical analysis/indicators for further confirmation.
Example – Use of stochastic:
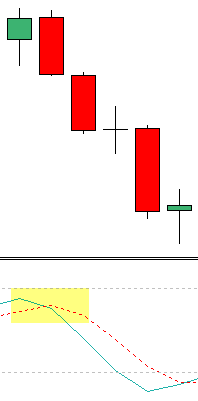
The stochastic line shows overbought signal which means most likely a reversal of price will occur. It sure did work.
I hope you enjoyed reading this short, simple post on Forex Candlestick Patterns. Do share and comment below if you like this. Thanks!
Best regards,
Tim Morris
admin @ ForexMT4Indicators.com
Recommended Forex Trading Broker
- Free $30 To Start Trading Instantly
- No Deposit Required
- Automatically Credited To Your Account
- No Hidden Terms

Recommended Candlestick Courses
Advance Forex Candlestick Patterns
&
Advance Forex Price Action Trading
Utile , semplice e chiaro: grazie
Thank you 🙂 Hope you learn something from here.
thanks for simplifying it